

< Back to Platform Development
By Johnny Liu, CEO at Dowway Vehicle
Published: March 4, 2026
- The Strategic Value of Chassis in Car Benchmark Analysis
- 5 Core Dimensions of Chassis-Focused Car Benchmark Analysis
- Mainstream Chassis Architectures: A Comparative Analysis
- The 9-Step Engineering Process for Car Benchmark Analysis
- Future Trends in Chassis Benchmarking
- Frequently Asked Questions About Car Benchmark Analysis
The Strategic Value of Chassis in Car Benchmark Analysis
The chassis carries the entire vehicle. It directly determines handling stability, ride comfort, braking safety, and NVH (Noise, Vibration, and Harshness) performance. Automakers face fierce competition today, with electric vehicles (EVs) and smart driving technologies updating rapidly. At the end of the day, buyers simply want a car that is “easy to drive, comfortable, and safe.” Delivering this requires exact chassis design and careful tuning.
Car benchmark analysis isn’t just copying. It is a strict, standardized engineering process. Engineers systematically measure, tear down, test, and study competitor vehicles. They look at chassis structures, performance numbers, materials, building methods, and tuning setups. This approach helps teams spot exact technical gaps. It turns proven features into hard data for setting new car targets and lowering design risks. Ultimately, a solid benchmark program shortens R&D cycles by 30%-40% and makes the final product much stronger.
Whether you are building a new EV from scratch, updating an Internal Combustion Engine (ICE) vehicle, or upgrading a modular platform, chassis benchmarking remains an essential tool.
5 Core Dimensions of Chassis-Focused Car Benchmark Analysis
Good benchmark analysis avoids empty theories. It relies on real data across five main areas: Structure, Performance, Materials, Manufacturing, and Tuning.
1. Structural and Architectural Benchmarking (The Engineering Foundation)
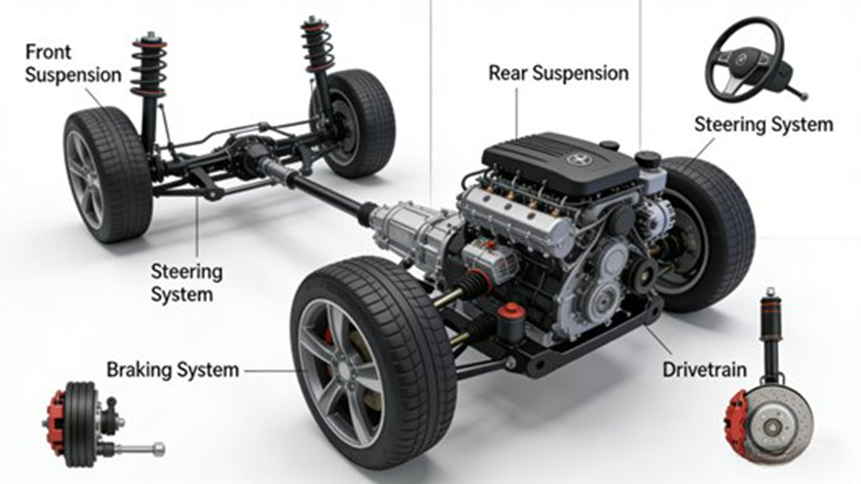
Structure sets the physical limits of chassis performance. This phase looks at:
- Body-to-Chassis Connection: Comparing unibody (focusing on weight reduction and comfort) versus body-on-frame (focusing on off-road durability) structures. Engineers count the connection points and measure bolt specifications and tightening torques to see their effect on overall torsional stiffness.
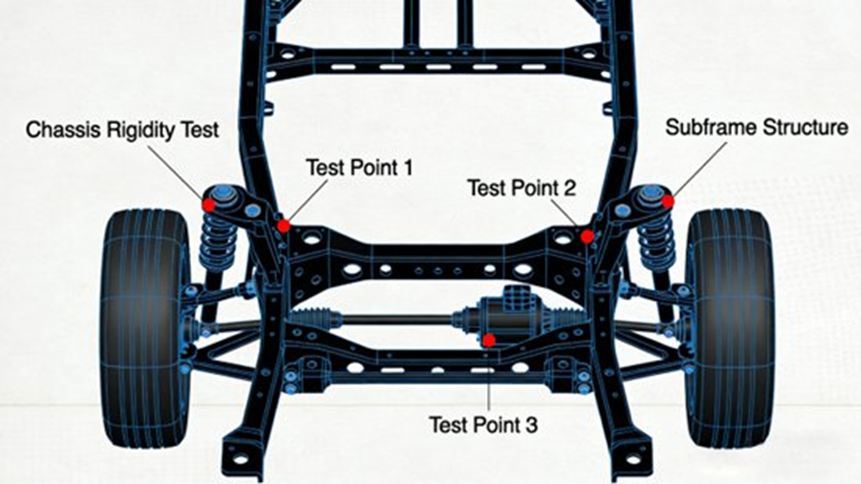
- Subframe Design: Evaluating front and rear subframes. Full-frame subframes improve crash safety, while aluminum subframes reduce unsprung mass.
- Suspension Layout: Measuring hardpoint coordinates—such as control arm lengths, swing angles, and ball joint locations—of front suspensions (MacPherson, Double Wishbone) and rear suspensions (Multi-link, Torsion Beam) to guide kinematic design.
- Fundamental Kinematics: Recording changes in camber, toe, and caster angles across varying steering angles and ride heights. This lays the groundwork for K&C (Kinematics and Compliance) testing.
2. Performance Benchmarking (The Core Objective)
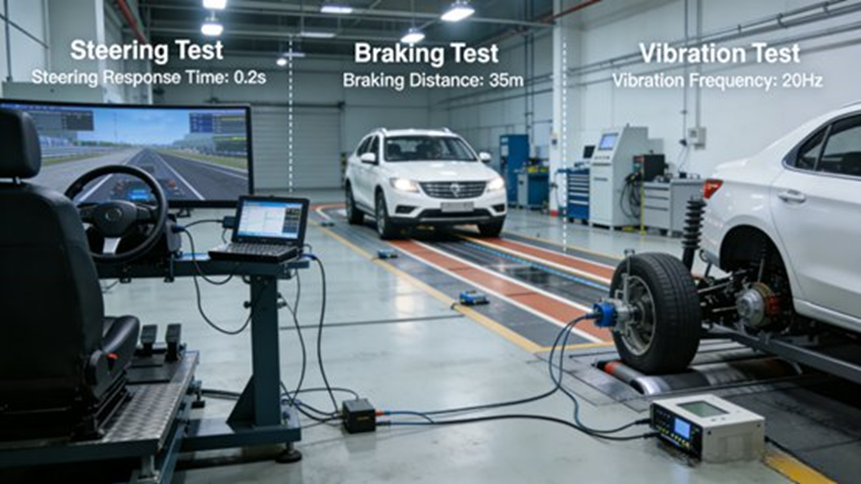
Performance metrics put a number on the gap between your product and the benchmark. Teams follow standard rules (like ISO, SAE, GB/T) to test:
- Handling and Stability: Using steering robots and Inertial Measurement Units (IMUs) to record steering sensitivity, understeer gradient, returnability, and steady-state circular driving.
- Ride Comfort: Driving on standard surfaces (washboard, cobblestone, undulating roads) to measure body acceleration, suspension dynamic deflection, and tire dynamic load. Combined with driver seat comfort scores, this reveals the competitor’s damper curve and spring rate logic.
- Braking Performance: Following GB/T 38902-2020 standards to measure 100-0 km/h braking distance, deceleration, and thermal fade (the decay rate after 10 continuous hard stops). Engineers also test pedal feel and ABS/ESC calibration.
- NVH Performance: Recording road noise (such as interior Sound Pressure Level at a steady 100 km/h) and vibration transfer rates to decode the noise-reduction designs of bushings, bump stops, and exhaust hangers.
3. Lightweighting and Material Benchmarking (Cost vs. Performance)
Shedding weight reduces fuel use in ICE cars, boosts EV range, and sharpens handling.
- Material Types: Tearing down control arms, subframes, knuckles, and brake discs to identify materials. Premium cars often use aluminum control arms to lower unsprung mass, while economy cars rely on high-strength steel to keep costs low.
- Lightweighting Parameters: Weighing individual parts, total chassis weight, unsprung mass, and axle load distribution. Teams evaluate design choices like hollow control arms or integrated casting.
- Material Performance: Testing tensile, yield, and fatigue strength. The goal is to ensure the chosen materials meet the benchmark standards while balancing manufacturing costs (for instance, aluminum casting costs versus steel stamping).
4. Manufacturing Processes and Durability Benchmarking
A chassis is only as good as its lifespan.
- Processing Techniques: Looking closely at stamping, casting, forging, and welding. For example, forged steering knuckles increase strength, while robotic welding on subframes guarantees exact dimensions.
- Connection Techniques: Checking bolts, rivets, and structural adhesives. Measuring tightening torques and bonded areas reveals how they support stiffness and durability.
- Durability Testing: Running bench tests for bushing and control arm fatigue, alongside tough road tests (like 100,000 km endurance runs) to find design flaws and match the benchmark’s lifespan.
5. Tuning Strategy Analysis (The “Soul” of the Chassis)
Even with the exact same hardware, tuning creates vastly different driving experiences.
- Suspension Tuning: Plotting damper compression/rebound curves and spring/bushing stiffness to see how the car behaves over low-speed bumps versus high-speed corners.
- Steering Tuning: Analyzing the EPS (Electric Power Steering) assist torque curve, gear ratio, and dead zone. The objective is to find the right balance between low-speed lightness and high-speed stability.
- Braking Tuning: Mapping pedal travel allocation, pressure curves, and ABS/ESC timing to make sure the braking force matches the vehicle’s weight and speed.
Mainstream Chassis Architectures: A Comparative Analysis
Choosing the right suspension matters most. Here is a breakdown of the 4 most common setups:
| Suspension Type | Structural Features (Measured) | Performance Advantages | Engineering Disadvantages | Typical Application |
| MacPherson Strut | Single wishbone + damper. Simple, saves space. Arm length typically 350-450mm. | Very light (front single side 8-12kg), low cost, good basic comfort. | Low lateral stiffness (1500-2000 N/mm), average steering precision, noticeable body roll. | Economy Cars (Toyota Corolla, VW Lavida) |
| Double Wishbone | Upper/lower A-arms. Independent camber/toe control. Arm length ratio approx. 1.2:1. | High lateral stiffness (3000-4000 N/mm), exact steering, strong grip, high-speed stability. | Bulky, heavy (15-20kg single side), high cost, harder to build. | Luxury/Sports Cars (BMW 3 Series, Porsche 911) |
| Multi-link | 3-5 independent control arms (mostly 4-5). Highly adjustable hardpoints. | Balanced handling and comfort. Highly tunable. | Hard to tune, high cost, strict assembly precision needed. | Premium/EVs (Mercedes E-Class, Tesla Model 3) |
| Torsion Beam | Non-independent. Wheels connected by U/V-shaped beam. Very compact. | Low cost, highly reliable, saves rear cabin space, easy to fix. | Coupled wheel movement, average comfort, rolls in fast corners. | Compact Cars (VW Polo, Honda Fit) |
EV vs. ICE: Differences in Car Benchmark Analysis
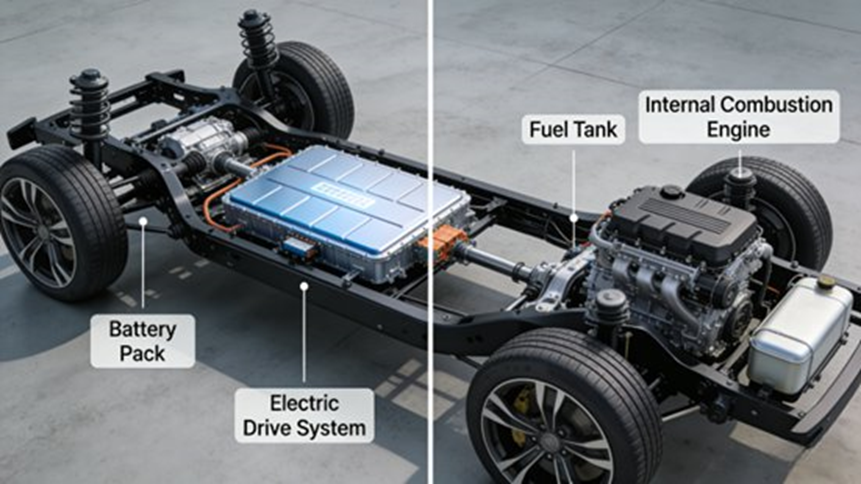
The fast growth of EVs changes what we measure:
- Center of Gravity (CG): EV batteries lay flat. This makes the CG 15-20% lower than ICE vehicles (EV: 450-500mm vs. ICE: 550-600mm). Tuning must adapt to this low-CG reality.
- Unsprung Mass: In-wheel motors add unsprung mass. Teams study aluminum rims and hollow driveshafts to fix ride harshness.
- Chassis Flattening: Without an exhaust, EVs need better aerodynamic shielding and battery protection to cut drag and wind noise.
- NVH Differences: No engine noise means road noise sounds louder. Engineers focus heavily on bushing design and cabin soundproofing.
- Integration: Methods like CTB (Cell-to-Body) or CTC (Cell-to-Chassis) force teams to benchmark structural rigidity, weight, and assembly steps together.
Key Sub-System Benchmarking Details
- Steering: EPS values usually show low-speed assist at 3-5 N·m and high-speed assist at 1-2 N·m. Ratios range from 14:1-18:1 (standard) to 12:1-14:1 (sport). Dead zones must be ≤3° and return error ≤5°.
- Braking: 100-0 km/h targets sit at ≤38m for compacts and ≤35m for premium cars. Thermal fade must stay ≤10%. Electric systems (like E-booster or One-Box) are tested for response times and energy recovery.
- Chassis Stiffness: Torsional stiffness targets are ≥20,000 N·m/deg for compacts and ≥30,000 N·m/deg for premium cars. Finding out how much the front and rear subframes contribute helps engineers balance stiffness and weight.
The 9-Step Engineering Process for Car Benchmark Analysis
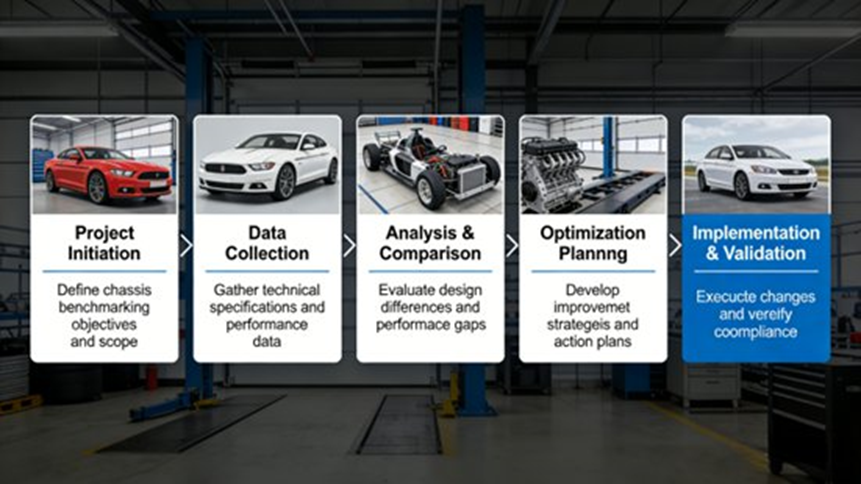
To avoid bad guesses, automakers follow a strict 9-step workflow:
- Target Setting & Selection: Define R&D goals and pick 2-3 benchmark models to create a Chassis Target Book.
- Basic Measurement: Use 3D scanners and scales to record dimensions, clearance, weight, axle load, and CG.
- K&C Testing: Use a rig to test kinematics and compliance (the stiffness of the suspension, bushings, and steering).
- Subjective Evaluation: Expert drivers score handling, NVH, and pedal feel on a 10-point scale on standard tracks and open roads.
- Objective Testing: Track testing for hard data on handling, comfort, and braking.
- Teardown & Measurement: Take the chassis apart to measure materials, geometry, weight, and build quality (like bushing installation angles).
- CAE Simulation: Build virtual models in software (like HyperWorks or Abaqus) to run structural and NVH tests.
- Gap Analysis: Compare competitor data against your own designs to set performance goals.
- Application: Write the Final Benchmark Report to guide part selection, tuning, and daily R&D work.
Future Trends in Chassis Benchmarking
- Structural Integration: The industry leans toward Skateboard chassis and integrated die-casting to drop weight and speed up production.
- Smart Chassis: Technologies like Steer-by-Wire (SBW), Brake-by-Wire (BBW), Continuous Damping Control (CDC), and rear-wheel steering are standard. Testing now looks closely at system response times and software rules.
- Advanced Lightweighting: Finding the sweet spot between cost and weight using hollow structures, aluminum, and composites remains a core task.
- Virtual Benchmarking: CAE simulation is the new normal. It cuts down physical prototype needs and saves money.
Frequently Asked Questions About Car Benchmark Analysis
While the breakdown above looks at chassis engineering, here are five common questions about general car benchmark analysis across the auto industry.
What is Car Benchmark Analysis?
Car benchmark analysis is a step-by-step process used by auto companies and researchers to compare a vehicle’s performance, design, cost, and tech against competitors. The goal is to find performance gaps and understand competitor strategies. Teams test, measure, and physically take apart competitor cars to study their parts and engineering choices.
What Key Metrics Are Used in Car Benchmark Analysis?
Car benchmarking uses hard numbers to rate vehicle performance. The most common metrics include:
- Performance: Acceleration (0–100 km/h), top speed, braking distance, and handling.
- Efficiency: Fuel economy (L/100km), energy use (kWh/100km for EVs), and CO2 emissions.
- Engineering: Powertrain output, aerodynamics (drag coefficient), and thermal management.
- Safety: Crash test scores (like NCAP) and ADAS tracking.
- User Experience: Cabin comfort, noise levels (NVH), and screen usability.
Why Is Benchmark Analysis Important for Car Manufacturers?
Building cars is expensive and highly technical. Manufacturers use benchmarking to find weak spots, speed up product development, reduce design mistakes, and track what buyers want. By studying rival vehicles up close, companies spot smart engineering solutions—like better EV battery layouts or cheaper production methods—that help them improve their own platforms.
What Are the Typical Steps in a Car Benchmark Analysis?
Engineering firms use a set workflow. A typical high-level process includes:
- Defining Objectives: Pick competitor models and set target numbers.
- Vehicle Acquisition: Buy the rival cars for testing.
- Static Measurement: Check car dimensions, weight spread, and frame design.
- Dynamic Testing: Test acceleration, braking, and handling on a track.
- Teardown Analysis: Take the car apart to study materials and how parts fit together.
- Data Synthesis: Save results in databases to compare across different cars and write engineering reports.
What Challenges Exist in Car Benchmark Analysis?
While useful, benchmarking brings challenges. Full teardowns and track tests cost a lot of money and take time. Modern cars also have thousands of parts and heavy software, causing data overload. Also, the fast changes in EVs and autonomous driving force teams to invent new testing methods constantly. To solve this, the industry relies more on standard frameworks and virtual CAE software.
Ready to upgrade your vehicle engineering? Whether you need hard data on the latest EV platforms or a full structural teardown, Dowway Vehicle has the tools to speed up your R&D. Contact us today to see how our benchmark testing can give your next vehicle a clear edge.
