
< Back to Platform Development
By Johnny Liu, CEO at Dowway Vehicle
Published: March 6, 2026
Executive Summary (TL;DR): As vehicles shift toward electrification, intelligence, and connectivity, traditional distributed electronics fail to keep up. The E&E Architecture Synoptic Chart serves as the engineering blueprint mapping a vehicle’s hardware, software, and communication networks. This guide tracks the shift from scattered networks (100+ ECUs) to modern Zonal Architectures and High-Performance Computers (HPCs). It details the specific technologies (MBSE, SOA, AUTOSAR) required to build Software-Defined Vehicles (SDVs).
- 1. Visualizing the Software-Defined Vehicle
- 2. What Does the Synoptic Chart Represent?
- 3. Tracing the Evolution on the Chart
- 4. Decoding the Layers of the Blueprint
- 5. Key Technologies Powering the Architecture
- 6. Engineering Bottlenecks: Realizing the Chart
- 7. Future Trends
- 8. The Bottom Line
- 9. Frequently Asked Questions About E&E Architecture Synoptic Charts
- Q1: What is an E&E Architecture Synoptic Chart?
- Q2: Why is a Synoptic Chart important in vehicle development?
- Q3: What components are typically included in the chart?
- Q4: How do modern architectures (Domain / Zonal) affect Synoptic Charts?
- Q5: Who uses E&E Architecture Synoptic Charts in the automotive industry?
- Summary Quick Reference
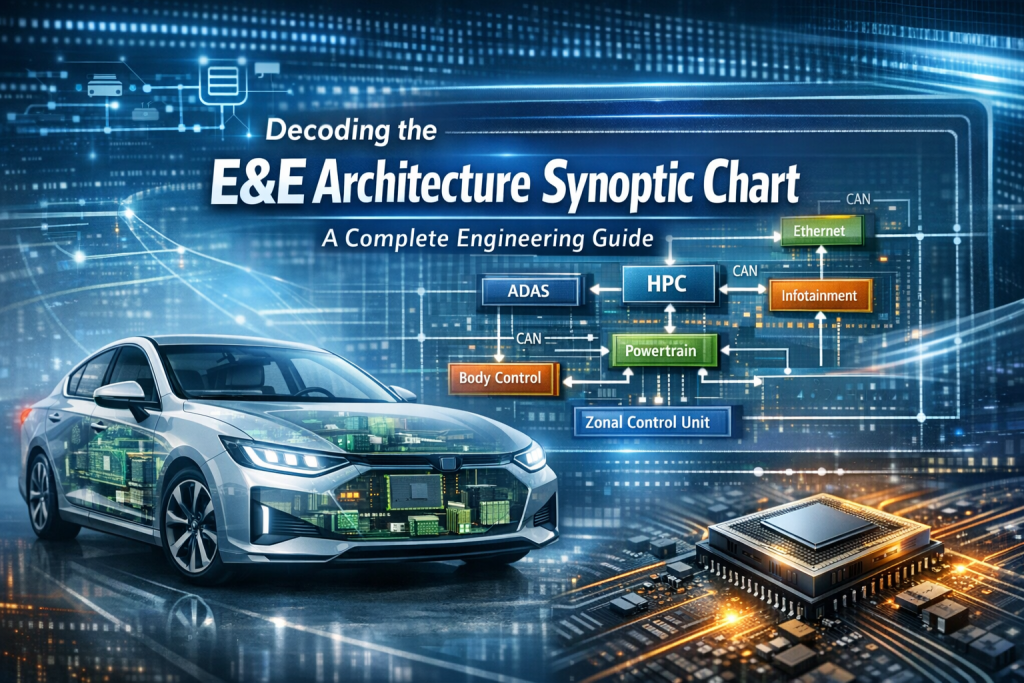
1. Visualizing the Software-Defined Vehicle
The car industry is changing fast due to electrification, intelligence, and connectivity. Old distributed electronic architectures cannot handle the new demands for quick software updates, massive computing power, and strict cost controls.
Vehicle electronic systems carry extreme complexity. While older internal combustion engine (ICE) vehicles relied on 30 to 50 Electronic Control Units (ECUs), high-end smart electric vehicles now use well over 100 ECUs covering the powertrain, chassis, smart cockpit, and autonomous driving. The outdated “one function equals one ECU” model creates redundant wiring, scattered computing power, and tied-up hardware and software. It stops Over-The-Air (OTA) updates and blocks smart driving and V2X (Vehicle-to-Everything) features.
Engineers use the E&E Architecture Synoptic Chart to fix this issue. This visual blueprint acts as the “skeleton” of the vehicle’s electronic system. Mastering this chart helps teams share resources, sync functions, control costs, and speed up iteration.
2. What Does the Synoptic Chart Represent?
An E&E Architecture Synoptic Chart is more than a basic wiring diagram. It is the full blueprint mapping out power distribution, signal networks, data routing, diagnostics, fault tolerance, and energy management based on cost and performance analysis.
When you read this chart, you see a system-level design resting on three pillars:
- Hardware as the foundation: The physical layout of compute units, sensors, and actuators.
- Software as the core: The operating systems, middleware, and applications defining the vehicle’s features.
- Communication as the link: The high-speed networks that allow seamless data exchange.
3. Tracing the Evolution on the Chart
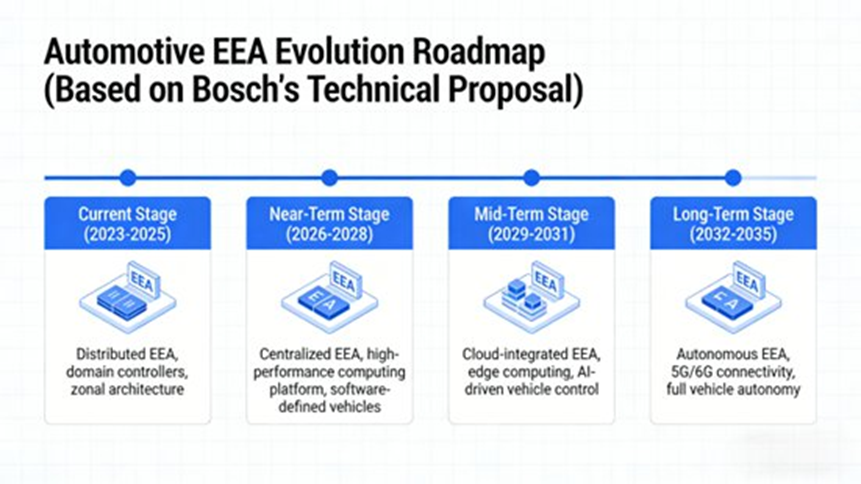
The synoptic chart shows a clear history. Physical layouts grew simpler while computational logic grew larger. We can track this shift across four distinct engineering phases.
Phase 1: Distributed Architecture (Pre-2015)
- Chart Characteristics: Built on the “independent function” idea. Every function needed its own ECU, communicating via simple CAN/LIN buses.
- Engineering Pain Points: Wiring was massive. The 2007 Audi Q7 and Porsche Cayenne packed over 6 kilometers of wiring weighing more than 70 kilograms—the heaviest vehicle part after the engine. ECU fragmentation caused slow testing, hard fault tracking, and impossible OTA updates due to varying supplier protocols.
- Typical Applications: Pre-2010 ICE vehicles like the 2010 Audi A8 (100+ ECUs) and the 2013 VW Lavida. Early new energy vehicles also used 80-150 ECUs.
Phase 2: Domain-Centered Architecture (2015-2025)
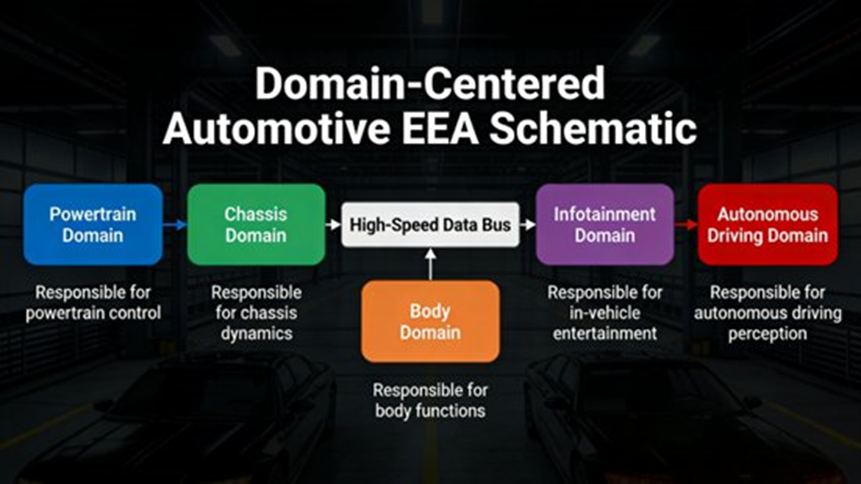
- Chart Characteristics: Built on “functional aggregation.” The vehicle splits into specific domains (powertrain, chassis, smart driving, infotainment), each managed by a Domain Control Unit (DCU). Total ECUs fell to 30-80.
- Engineering Highlights: Automotive Ethernet works as the domain backbone, with a central gateway routing cross-domain traffic. This cuts wire harness weight and supports domain-level OTA updates.
- Typical Applications: Volkswagen MEB platform’s E3 architecture (3 In-Car Application Servers or ICAS), BMW iNEXT’s three-domain setup (BDC, SAS, MGU), and Huawei’s CC architecture.
Phase 3: Zonal Architecture (2020-2030)
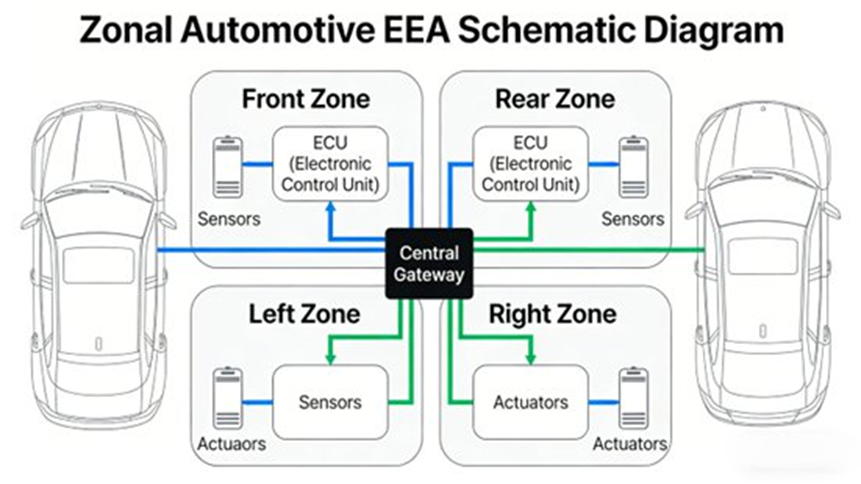
- Chart Characteristics: Blends “location aggregation” with “functional fusion.” The vehicle splits by physical zones (left-front, right-front, rear) managed by Zonal Control Units (ZCUs), overseen by centralized High-Performance Computers (HPCs).
- Engineering Highlights: Wiring harnesses shrink by 30% to 50%. The ZCU handles local sensor/actuator access and power, while HPCs manage complex cross-domain computing. This brings in Service-Oriented Architecture (SOA) and totally separates hardware from software.
- Typical Applications: Tesla Model 3/Y (Central Compute + Zonal Controllers), Xpeng G9 (X-HP smart central compute), and NIO ET5.
Phase 4: Central Compute + Zonal Access (The Future)
- Chart Characteristics: Focused strictly on “compute centralization.” The vehicle keeps only 1 to 3 ultra-powerful HPCs acting as the central brain. ZCUs downgrade to smart junction boxes and routers.
- Engineering Goals: A true cloud-edge-device layout via star-topology Ethernet. It aims to match smartphone software update speeds, slash hardware costs, and fully run L4+ autonomous driving and V2X.
4. Decoding the Layers of the Blueprint
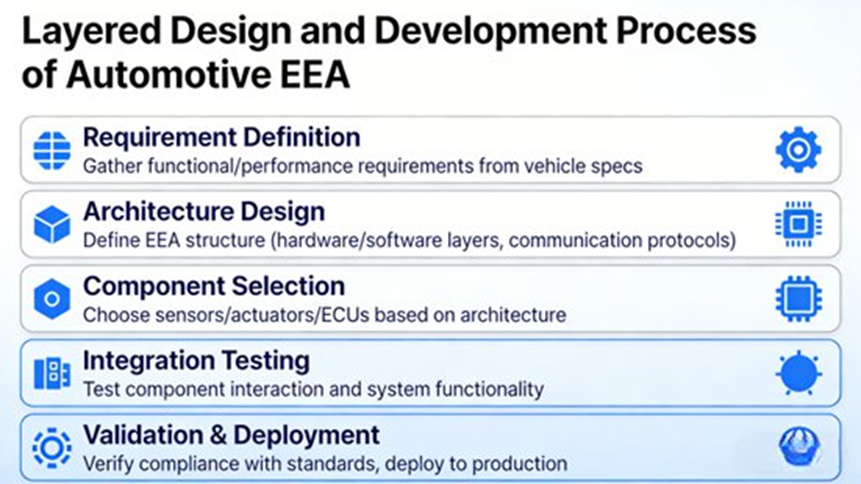
A professional synoptic chart visualizes a bottom-up layered design. Each layer remains independent yet highly collaborative to ensure system scalability.
- The Physical Layer (Hardware): Teams select chips (MCUs/SoCs), sensors (LiDAR, millimeter-wave radar, cameras), and actuators based on compute and automotive-grade needs. Wire harness design uses the “shortest path, minimum redundancy” rule with high/low voltage separation. It uses Intelligent Power Management Systems (IPMS) for partitioned, redundant power delivery for core safety functions.
- The Network Layer (Communication): Uses a mixed communication structure. 1000BASE-T1/10GBASE-T1 Automotive Ethernet handles high-bandwidth tasks (smart driving sensors). CAN FD handles mid-to-high speed real-time control (powertrain/chassis). LIN manages low-speed data (windows/lighting). Gateways handle cross-domain routing, protocol changes, and OTA security.
- The Function Layer (Core Capabilities): Breaks vehicle needs into executable modules. This covers cross-domain synergy (like Automatic Emergency Braking linking the ADAS and chassis domains) and dual-redundancy designs for safety-critical systems to meet ISO 26262 ASIL-D standards. It stores diagnostic data for engineers.
- The Application Layer (User Value): The user-facing result. It supports seamless OTA software updates (like Tesla adding auto-park without touching hardware), personalized vehicle settings (“one car, one setup”), and V2X vehicle-cloud synergy.
5. Key Technologies Powering the Architecture
To build the systems drawn on the synoptic chart, engineers rely on four main technology pillars:
- Model-Based Systems Engineering (MBSE): Using SysML/UML tools (IBM Rational Rhapsody, Siemens Polarion) to create a single data source. It links requirements straight to design and testing. For instance, an MBSE sequence diagram can strictly define LiDAR timing: “10ms emit -> 20ms fuse -> 5ms command -> 10ms respond.” Industry data shows MBSE cuts development cycles by 25-30% and catches 40% more early errors.
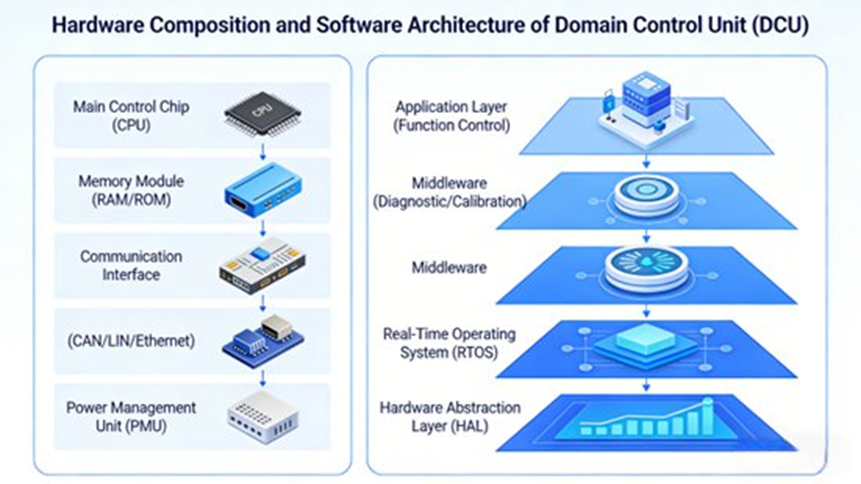
- Domain Control Unit (DCU) Development: DCUs need a mixed “SoC + MCU” computing setup. High-compute SoCs handle data fusion (Nvidia Orin, Horizon Robotics Journey 6), while MCUs (Infineon TC397) run real-time execution. BMW’s autonomous driving DCU (hPAD) uses 1x MCU (TC397) + 2x CPU (Intel Denverton) + 2x SoC (Mobileye EyeQ5). Software runs on AUTOSAR (BSW, RTOS, ASW). Strict thermal management keeps chips stable across automotive-grade temperatures (-40°C to 125°C).
- Service-Oriented Architecture (SOA): SOA packages functions (like “vehicle acceleration”) into standard services with defined Quality of Service (QoS). Using protocols like DDS or SOME/IP, it builds a service bus for dynamic scheduling. An application-layer “auto-park” service can call the chassis domain’s “steering service” without knowing the underlying hardware.
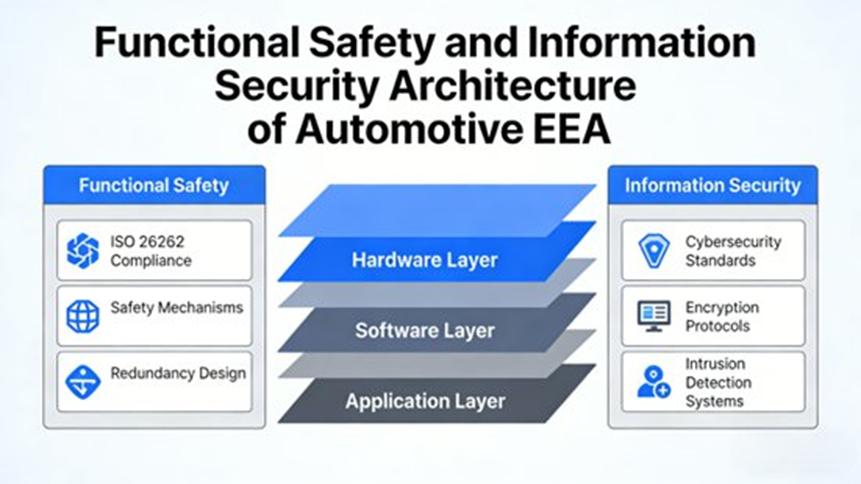
- Safety & Security Design: * Functional Safety (ISO 26262): Uses Fault Tree Analysis (FTA) and FMEA for hardware redundancy (dual LiDAR/camera setups or dual braking ECUs).
- Information Security (ISO/SAE 21434): Uses Hardware Security Modules (HSM), TLS/DTLS communication encryption, and intrusion detection software to build defense layers for data and OTA updates.
6. Engineering Bottlenecks: Realizing the Chart
Bringing the E&E synoptic chart from theory to mass production creates huge engineering hurdles:
- Challenge 1: Vague Requirements. Disconnects between vehicle-level needs and EEA design cause expensive late reworks. Solution: Set up a strict MBSE link mechanism and cross-departmental reviews to lock in needs early and keep architectural expansion interfaces open.
- Challenge 2: Cross-Domain Conflicts. Different vendor teams working on connected domains cause interface clashes. Solution: Use SOA to force unified service interfaces and run cross-domain collaborative development platforms and early integration testing.
- Challenge 3: Hardware/Software Integration. Poor compatibility among different suppliers causes communication faults. Solution: Set strict hardware interface standards, detach software via modular design, and run strict phased integration testing (unit, integration, system).
- Challenge 4: Testing Coverage. Traditional testing cannot check the infinite edge-cases of multi-domain setups. Solution: Use a “Virtual Simulation + Real-Vehicle” integrated testing matrix using tools like dSPACE and Prescan to catch errors early, backed by automated testing tools.
7. Future Trends
The synoptic chart will continue to change as technology moves forward:
- Hyper-Centralization: Central Compute + Zonal Access will become the norm. Central HPCs will cross 1000 TOPS (int8) computing power to run L4+ autonomous driving.
- Standardized Software Platforms: SOA will act as the absolute standard, creating unified vehicle operating systems that slash development costs and speed up iterations.
- Deep Intelligence & Connectivity: EEA will merge seamlessly with AI, Big Data, and Edge Computing. This enables real-time smart scheduling, predictive maintenance, and V2X ecosystem integration with ultra-low latency.
- Upgraded Security Ecosystems: Functional safety and cybersecurity will fuse into a strict defense framework capable of operating safely in extreme physical and digital environments.
8. The Bottom Line
The development of the E&E architecture marks a vehicle’s shift from a mechanical product to a smart electronic device. For automotive engineers and R&D managers, mastering the E&E Architecture Synoptic Chart is an absolute necessity. By understanding its history, layered design, and core technologies (MBSE, SOA, DCU), teams can fix integration bottlenecks. As centralization continues, this architectural blueprint serves as the base for the Software-Defined Vehicle.
9. Frequently Asked Questions About E&E Architecture Synoptic Charts
Q1: What is an E&E Architecture Synoptic Chart?
Short Answer: It is a high-level visual diagram that maps out a vehicle’s entire electrical and electronic system architecture.
Details: It serves as a visual summary of how major electronic components organize and connect. Its primary purpose is to give system engineers and stakeholders a single “big-picture” view of the vehicle’s electronic system structure. The chart typically displays:
- Electronic Control Units (ECUs)
- Communication networks (CAN, LIN, FlexRay, Automotive Ethernet)
- Functional domains (ADAS, infotainment, powertrain, body)
- Data flow and overall system hierarchy
- Central or zonal controllers
Q2: Why is a Synoptic Chart important in vehicle development?
Short Answer: It coordinates the design of hardware, software, networks, and wiring across multiple engineering teams.
Details: Multiple engineering teams must design systems simultaneously, and vehicle functions depend entirely on the data exchanged between ECUs. OEMs and suppliers rely on this overview to ensure that ECU hardware, software deployment, communication bandwidth, and physical harness routing remain perfectly consistent with the overall vehicle system design.
Q3: What components are typically included in the chart?
Short Answer: It includes ECUs, sensors, actuators, communication networks, and functional domains.
Details: A standard synoptic chart visualizes several integrated layers of the vehicle’s electronic system. Key components typically mapped include:
- Core Elements: ECUs (Electronic Control Units), various sensors, and actuators.
- Control Examples: ABS/Brake ECUs, ADAS compute platforms, Infotainment controllers, Body Control Modules (BCM), and Gateway ECUs.
- Communication Networks: CAN, LIN, FlexRay, and high-speed Automotive Ethernet.
Q4: How do modern architectures (Domain / Zonal) affect Synoptic Charts?
Short Answer: They shift the chart’s layout from dozens of scattered ECUs to centralized domains and physical zones.
Details: As modern vehicles require more computing power, seamless connectivity, and tight cybersecurity, their architectures are centralizing. Synoptic charts visually reflect this shift:
- Older Architectures (Distributed): Charts display dozens of independent, function-specific ECUs connected by heavy wiring harnesses.
- Domain Architectures: Charts show functions grouped logically into distinct domains, such as Powertrain, ADAS, Infotainment, and Body electronics.
- Zonal Architectures: Charts are organized by physical vehicle location (e.g., Front zone, Rear zone, Left/Right zones), all reporting back to a powerful Central Compute Unit.
Q5: Who uses E&E Architecture Synoptic Charts in the automotive industry?
Short Answer: OEM system architects, hardware engineers, network planners, and wiring harness designers rely on these charts.
Details: Because modern vehicle subsystems constantly share data, multiple specialized teams must coordinate through this architectural model. Primary users include:
- OEM System Architects: To define the overall vehicle architecture and functional distribution.
- Hardware Engineers: To design specific ECUs, sensors, and computing platforms.
- Network Engineers: To plan communication protocols, topographies, and bandwidth limits.
- Wiring Harness Engineers: To determine physical cable routing, weight distribution, and connections.
- Software Architects: To accurately map software functions and services to the correct hardware nodes.
Summary Quick Reference
| Question | Key Point |
| What is it? | A high-level visual diagram of a vehicle’s electronic system architecture. |
| Why is it important? | It coordinates hardware, software, network, and wiring design across teams. |
| What does it include? | ECUs, sensors, actuators, network protocols, and functional domains. |
| How is it evolving? | Moving from scattered ECUs to consolidated domain and zonal architectures. |
| Who uses it? | OEM system architects, ECU hardware engineers, network planners, and harness designers. |
