

< Back to Vehicle Design & Engineering Hub
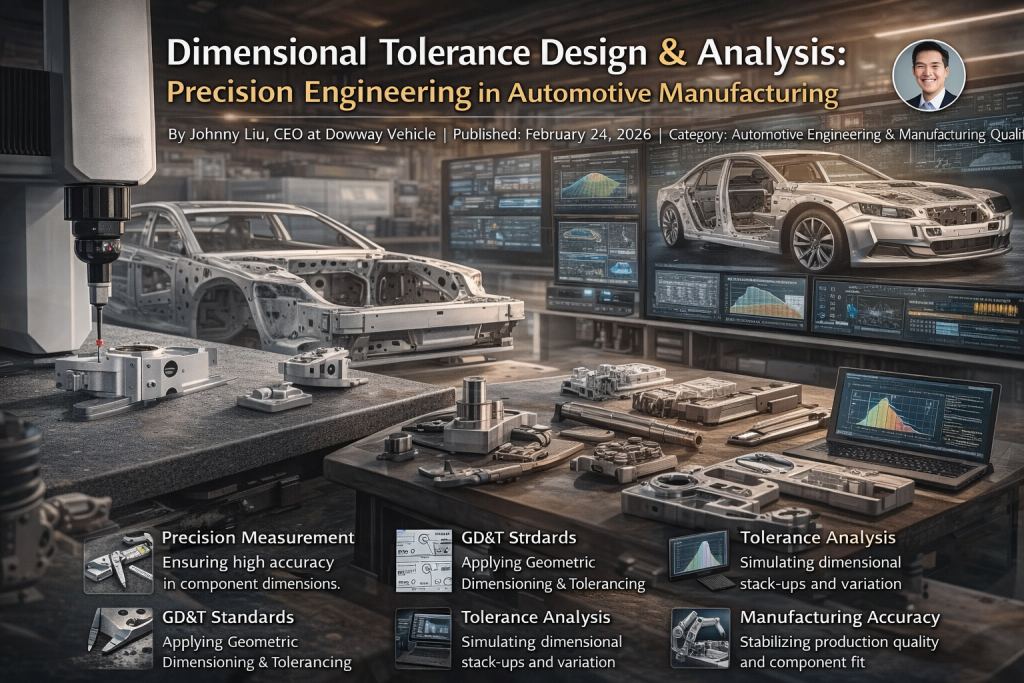
By Johnny Liu, CEO at Dowway Vehicle Published: February 24, 2026 Category: Automotive Engineering & Manufacturing Quality
Introduction: Why Tolerances Matter on the Factory Floor
A modern automobile contains between 10,000 and 15,000 core components. Add small hardware like screws, and the count easily tops 20,000. Getting these individual parts to form a precise, working vehicle comes down to one core engineering practice: dimensional tolerance design and analysis. It acts as the physical link between the initial design, actual manufacturing, and final assembly.
Good tolerance design guarantees that parts fit together. It maintains vehicle sealing, handling stability, and NVH (Noise, Vibration, and Harshness) performance. It also keeps manufacturing costs under control. Go too strict, and your production costs multiply. Go too loose, and you end up with assembly interference, uneven panel gaps, and operational failures.
Let the numbers speak for themselves. A J.D. Power survey found that 41% of automotive quality issues stem directly from geometric quality defects. Poor dimensional tolerance design and analysis is usually the root cause.
The shift toward New Energy Vehicles (NEVs) pushes these limits further. For example, the tolerance at the connection points between an NEV battery pack and the vehicle body must stay strictly within ±0.5mm for safety reasons. Engineering teams need a scientific tolerance management system. It is no longer an option; it is a hard requirement.
1. Core Concepts and Industry Standards
Engineering requires clear definitions. Without them, mistakes happen. Here is the standard terminology used in tolerance design.
1.1 Fundamental Definitions
- Basic Size: The theoretical dimension set during the design phase (e.g., the exact bore diameter of an engine block). It serves as the baseline.
- Actual Size: The physical dimension you get when measuring the part after production.
- Limit Size: The maximum and minimum boundaries allowed.
- Tolerance Zone: The permitted variation range (the difference between upper and lower deviations). A smaller zone means higher precision and a harder time machining the part.
- GD&T (Geometric Dimensioning and Tolerancing): Controls for shape (flatness, roundness) and position (parallelism, perpendicularity, coaxiality). A part can have the correct dimensions but still fail assembly if its geometric errors are too large.
- Dimensional Chain: A closed-loop group of interconnected dimensions formed during assembly. It includes the Closing Ring (the final accuracy you need) and Component Rings (dimensions created directly during manufacturing).
1.2 Global and Domestic Industry Standards
Using standard frameworks ensures parts fit together, regardless of who makes them.
- International Standards: ISO 1101 (GPS symbols), ISO 14253 (inspection rules), and ISO 286-1/2 (linear and angular tolerance classes).
- Industry-Specific Standards: SAE J1455 covers tolerance and inspection rules for automotive bodies. ASME Y14.5-2018 sets rules for Model-Based Definition (MBD) tolerancing.
- Chinese National Standards (GB): GB/T 1182 (GD&T rules), GB/T 1800 (linear/angular tolerances), and GB/T 26730 (measurement methods for body deviations).
- Corporate Standards: Large OEMs use their own internal rules. Volkswagen’s RPS (Reference Point System) is a prime example, offering specific guidelines for datum selection.
2. The 4 Core Principles of Tolerance Design
Tolerance design is a constant trade-off between precision, performance, and budget. Engineers rely on four main principles to make these calls:
- Function First: The product has to work. Critical functional areas need strict control. The mating surface between an engine block and cylinder head requires a flatness tolerance of ≤0.05mm/500mm to stop leaks. Brake disc runout must stay at ≤0.05mm to prevent shudder. Door diagonal differences should be ≤3mm so the door seals and closes properly.
- Economic Efficiency: Precision costs money. Where function allows, widen the tolerances. Machining an IT5 grade tolerance costs over 30% more than an IT7 grade. Non-visible body panels and standard hardware do not need aerospace-level precision.
- Manufacturability: Designs must match real-world factory limits. Stamped parts deal with material spring-back and die wear; they simply cannot reach the precision of CNC machining. Lightweight materials like carbon fiber change shape with heat. You must leave room for these realities.
- Interchangeability: Mass production relies on parts swapping out easily. Standardized tolerances for components like doors and fenders mean any part fits any vehicle body on the line. This keeps repair costs and assembly times low.
3. The 6-Step Tolerance Design Lifecycle
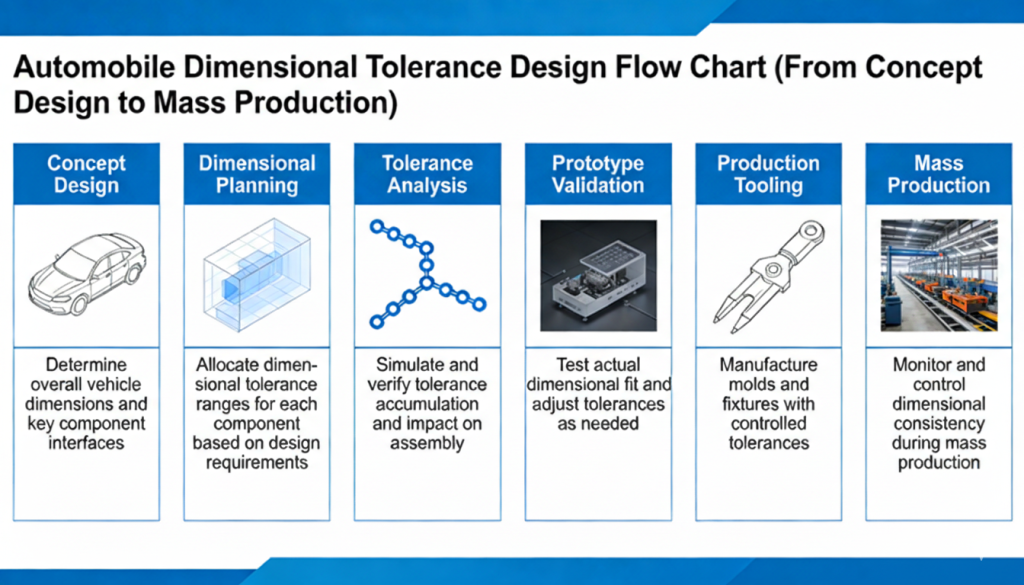
Managing tolerances is an ongoing process from R&D to mass production. It follows a tight, closed-loop workflow:
- Define Requirements & Datums: Establish critical dimensions and use a unified datum framework (like RPS) to prevent baseline confusion.
- Initial Allocation: Categorize dimensions based on how critical they are. Class A (battery mounting holes) gets tight limits. Class C (internal non-mating surfaces) gets loose limits.
- Chain Construction & Allocation: Build the dimensional chain. Distribute the final tolerance among the individual parts using extreme value or statistical methods.
- DFM (Design for Manufacturability) Review: Work with the manufacturing teams. Check if the proposed tolerances are actually doable with current factory equipment. Adjust designs that cost too much to produce.
- Prototyping & Validation: Measure physical prototypes using CMMs (Coordinate Measuring Machines) and laser scanners. Run physical assembly tests to check for interference or bad gaps, then adjust the math.
- Mass Production & Dynamic Control: Lock down the blueprints. Monitor production data continuously and tweak tolerances as needed (for instance, tightening limits if a new factory machine is highly accurate).
4. Key Methods in Dimensional Tolerance Analysis
Analysis predicts deviation buildup so you can spot assembly risks early. The industry relies on traditional manual math and newer digital simulations.
4.1 Traditional Manual Methods
These work best for simple, straight-line dimensional chains.
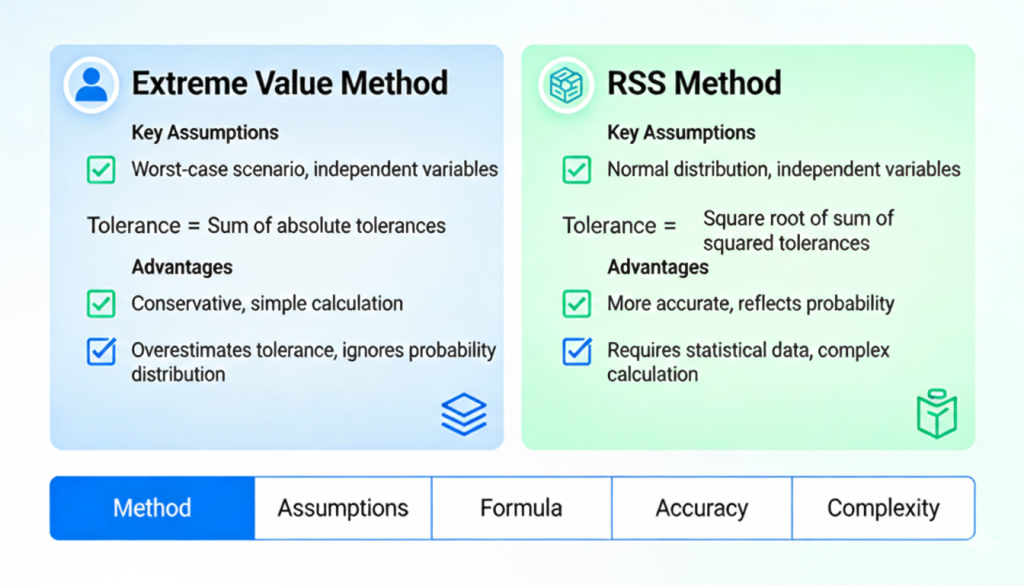
- Worst-Case Method: Calculates the absolute maximum and minimum limits of the final gap by assuming every part hits its extreme limit at the same time.
- Pros: Guarantees 100% interchangeability. Highly reliable for critical safety parts or small production runs (like calculating a 0.8-1.2mm door-to-fender gap).
- Cons: Highly conservative. The odds of every part hitting its extreme limit simultaneously are near zero. This leads to unnecessarily tight tolerances and higher costs.
- Root Sum Square (RSS) / Statistical Method: Assumes manufacturing deviations follow a normal bell curve. The total tolerance is the square root of the sum of the squares of the individual tolerances (\sqrt{\sum T_i^2}).
- Pros: Removes the heavy conservatism of the Worst-Case method. It allows wider individual tolerances, drastically cutting costs in mass production.
- Cons: Requires the assumption of a normal distribution. If the factory process is not normal, the math fails. It is risky for zero-failure safety systems.
4.2 Digital Simulation Methods
As cars get more complex, manual math falls short. Digital tools are now standard.
- CAT (Computer-Aided Tolerancing) Simulation: Uses software like 3DCS, VSA, or DTAS 3D. Engineers import 3D CAD models, define the chains, and simulate the physical assembly.
- Engineering Examples: Volkswagen used 3DCS to model the MEB platform (ID. series). By optimizing stamping and welding limits, they improved door gap uniformity by 60%. Tesla ran millions of Monte Carlo simulations in 3DCS for the Cybertruck, catching 73% of potential battery-to-body interference issues before building a physical prototype.
- Digital Twin Simulation: This moves from offline prediction to live factory control. It connects the 1:1 3D model with live Industrial IoT data (machine vibrations, cutting temperatures, real-time CMM feedback).
- Engineering Examples: BMW used a digital twin on the iX EV welding line. By tracking live robot positioning and thermal data, the system adjusted welding parameters on the fly, hitting a 99.2% dimensional pass rate. BYD used digital twins for the Seal’s battery pack production, fixing gap inconsistencies and boosting assembly efficiency by 40%.
5. Common Pitfalls and Practical Fixes
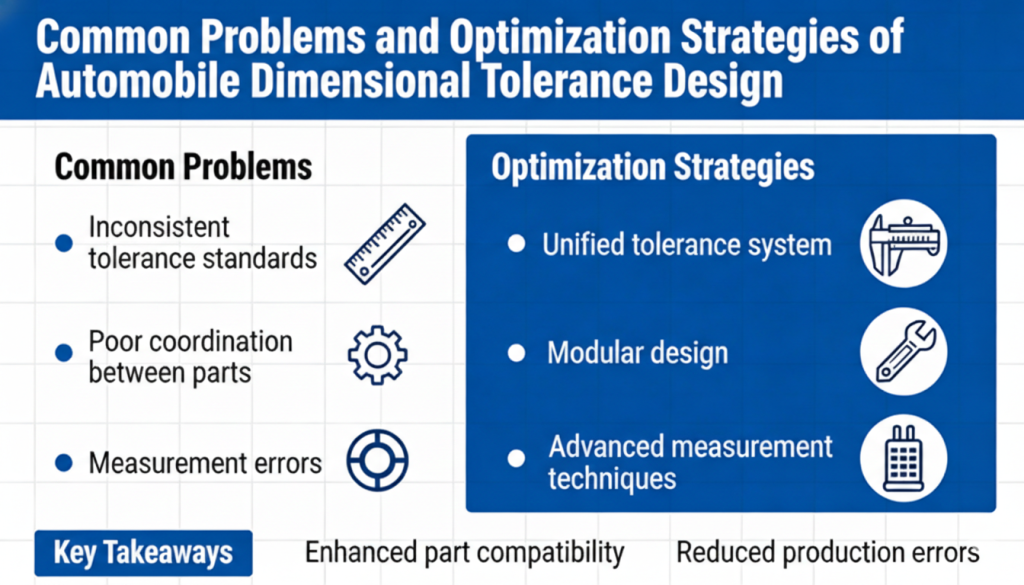
Even with great tools, teams run into issues that drive up costs and ruin assemblies. Here is what usually goes wrong and how to fix it.
- Confused Datums & Flawed Chains: Using multiple, unlinked datums creates chaos.
- Fix: Stick strictly to unified reference systems (like RPS). Cut out redundant datums.
- Unreasonable Allocation: Making critical parts too tight wastes money. Making general parts too loose causes parts to jam.
- Fix: Use A/B/C classification. Apply RSS or Monte Carlo simulations instead of splitting tolerances evenly across a chain.
- Neglecting GD&T: A part might be the exact right size, but bent. Poor coaxiality in an engine crankshaft will destroy NVH performance.
- Fix: Build flatness, perpendicularity, and coaxiality controls directly into your dimensional chain analysis.
- Misapplied Analysis Methods: Using the Worst-Case method for mass-produced parts forces impossible standards.
- Fix: Match the math to the job. Feed real factory variables (like spring-back coefficients and machine wear data) into your CAT software.
- No Control on the Line: Treating tolerance design as just an R&D job means things will fall apart during mass production.
- Fix: Use Statistical Process Control (SPC). Monitor parts continuously with CMMs, calibrate equipment regularly, and track material batches.
6. Where the Industry is Heading
Digital tools are reshaping how engineers handle tolerances.
- MBD (Model-Based Definition): 2D drawings are fading out. MBD builds all dimensional, GD&T, and measurement data directly into the 3D model. This creates a single source of truth for the CAT software.
- Artificial Intelligence (AI): Machine learning tools now scan historical dimensions, factory parameters, and cost data to output the most budget-friendly tolerance plans automatically. They spot errors early.
- Real-Time IIoT & Digital Twins: Industrial IoT feeds shop-floor data into digital twins. The system can then tweak CNC speeds or robot paths to correct drift in real time.
- The Shift in Software Suppliers: Western software (3DCS, VSA) used to dominate. Now, local alternatives (like China’s DTAS 3D and CAXA) offer powerful, budget-friendly options that fit specific regional manufacturing needs.
- Cross-Domain Collaboration: Design teams can no longer work in isolation. Cloud platforms allow R&D, manufacturing, quality control, and external suppliers to adjust tolerances together in real time.
Frequently Asked Questions (FAQ)
1. What is dimensional tolerance design and analysis?
Dimensional tolerance design and analysis refers to the process of specifying allowable variations in part dimensions and then predicting how these variations affect the assembly and performance of a product. Tolerance analysis quantifies how part-to-part variations influence the final assembly outcome, helping engineers ensure parts always fit and function together despite manufacturing variation. It uses methods such as worst-case and statistical stack-up analysis to model the cumulative effects of individual part tolerances.
2. Why is tolerance analysis critical in mechanical design?
Tolerance analysis is essential because real manufacturing processes always produce parts with slight deviations from nominal dimensions. By analyzing how these deviations “stack up” in an assembly, engineers can prevent problems like interference fits, alignment errors, or functional failures. Performing tolerance analysis early in the design phase reduces costly trial-and-error in manufacturing, ensures proper part fit and functionality, and optimizes costs by tightening only necessary tolerances.
3. What are the main methods for performing tolerance stack-up analysis?
The two main methods widely used for dimensional tolerance analysis are:
- Worst-Case Analysis: Adds the maximum allowed variation of each dimension to determine the extreme limits of the assembly outcome. It’s conservative and ensures fit even in the worst case.
- Statistical Analysis (RSS / Monte Carlo): Uses statistical distributions (e.g., normal distribution) to model the likelihood of variation combinations. Root-Sum-Square (RSS) and Monte Carlo simulation provide more realistic predictions in mass production when process data is available.
4. How do dimensional and geometric tolerances differ, and why both matter?
- Dimensional tolerances specify allowable variation in size measurements (length, diameter, etc.).
- Geometric tolerances control variations in form, orientation, location, and profile of features. Both types are important because mechanical fits depend on not just size variation but also how parts relate in space. Standards like ASME Y14.5 define symbols and rules for both dimensional and geometric tolerancing to ensure parts function as designed.
5. How should engineers allocate tolerances to balance performance and cost?
Effective tolerance allocation involves identifying critical dimensions that significantly influence assembly performance and tightening those tolerances to the minimum required for functional fit. Less critical dimensions can be assigned looser tolerances to lower manufacturing cost. Tolerance allocation is informed by tolerance analysis: by identifying which tolerances most influence key performance characteristics, designers can optimize tolerances for cost vs. reliability.
Useful Hi-Level Note: Tolerance stack-up is a foundational concept in dimensional tolerance design, allowing prediction of cumulative variation effects before manufacturing begins. Standards such as ISO GPS and ASME Y14.5 provide the rules and symbols used to communicate tolerances clearly in engineering documentation.
Final Thoughts
Dimensional tolerance design and analysis dictates vehicle assembly precision, product reliability, and market survival. By sticking to the rules of functionality, economy, manufacturability, and interchangeability, engineers hit the sweet spot between high precision and low manufacturing costs.
Lightweight NEV architectures and high-precision autonomous driving hardware will keep pushing tolerance limits. Using AI, Digital Twins, MBD, and cloud platforms is no longer just a bonus—it is the standard way to build a quality car today.

·