


< Back to Performance Development
Author: Johnny Liu, CEO at Dowway Vehicle
Last Updated: March 27, 2026
Article Type: Cluster Page
Primary Keyword: electric motor thermal analysis
Electric motor thermal analysis is the process of finding where heat comes from inside a motor, predicting how that heat moves, checking real temperatures through testing, and improving cooling so the motor can keep its power, reliability, service life, and safety. In EVs, heat control is one of the main limits on output and durability. If heat is not removed in time, the motor can suffer insulation aging, permanent magnet demagnetization, material damage, lower efficiency, or even burnout.
Quick take
- Motor heat mainly comes from copper loss, iron loss, mechanical loss, and stray loss.
- Heat inside a motor is uneven, and the hottest area is often the stator winding, especially the end winding region.
- The three core methods are analytical calculation, simulation analysis, and experimental testing.
- The most practical workflow is early estimation, detailed simulation, and physical validation.
- Future motor thermal work is moving toward multi-physics coupling, smart monitoring, and stronger cooling systems.
- Quick take
- Copper Loss
- Iron Loss
- Mechanical Loss
- Stray Loss
- Stator Side
- Rotor Side
- Other Parts
- Core Principle
- Key Steps
- Common Models
- Strengths
- Limits
- Finite Element Temperature Field Simulation
- CFD Flow-Temperature Coupling Simulation
- Why Simulation Matters
- Key Simulation Steps
- Strengths
- Limits
- Main Measurement Methods
- Infrared Thermal Imaging
- Embedded Temperature Measurement
- Test Platform
- Key Test Steps
- Strengths
- Limits
- Concept Design Stage
- Detailed Design Stage
- R&D Validation Stage
- Mass Production Stage
- Project Background and Thermal Risk
- Step 1: Loss Calculation and Heat Source Analysis
- Step 2: Detailed Simulation Analysis
- Step 3: Thermal Management Optimization
- Step 4: Re-Simulation After Optimization
- Step 5: Experimental Validation
- Engineering Takeaway From the Case
- Cooling-System Design
- Material Selection
- Structural Design Changes
- 1. Multi-Physics Coupling Is Becoming the Main Path
- 2. Smart Thermal Analysis and Real-Time Monitoring
- 3. New Cooling Technologies Are Getting Closer to Motor Design
- 4. Lightweight and Integrated E-Drive Systems Need Better Thermal Models
- 1. What are the dominant heat sources in high power-density EV motors today?
- 2. Why is traditional air cooling no longer sufficient for modern EV motors?
- 3. What are the most widely used thermal analysis methods in industry today?
- 4. What cooling technologies are getting the most attention in 2025 and 2026?
- 5. How is AI and intelligent thermal management changing motor design?
Why Electric Motor Thermal Analysis Matters in EVs
An automotive motor sits at the center of the powertrain. It converts electrical energy into mechanical energy and directly affects vehicle range, response, and operating stability.
Modern EV motors are moving toward higher power density, smaller size, lighter weight, and higher integration. That pushes more power into less space. The result is simple: more heat in a tighter package.
In many automotive drive motors, around 5% to 15% of the energy loss turns into heat. In high power-density motors, that figure can go above 20%. Once that heat starts to build up inside a compact structure made up of the stator, rotor, windings, shaft, bearings, and cooling system, thermal risk rises fast.
The working environment makes things harder. Automotive motors have to handle:
- high and low temperature cycling,
- vibration,
- shock,
- humidity changes,
- and changing load conditions.
Inside the motor, the heat path is not simple. It moves through solids, air gaps, housing parts, and cooling media. That is why thermal analysis is not just a check at the end. It is part of the design itself.
Good thermal analysis helps engineers:
- find heat sources early,
- calculate temperature distribution,
- check cooling efficiency,
- spot local hotspots,
- improve structures and parameters,
- raise reliability,
- extend service life,
- and cut development cost.
What Causes Heat in Electric Motors?
Short answer: Motor heat comes from energy loss during electrical-to-mechanical conversion, and the main losses are copper, iron, mechanical, and stray losses.
Different motor types, such as permanent magnet synchronous motors, induction motors, and DC motors, share the same basic heat-generation logic. What changes is the location of the heat and the share of each loss.
In EVs, the permanent magnet synchronous motor, or PMSM, is the most common drive motor because of its high efficiency and high power density. That makes PMSM heat behavior especially useful as a reference.
Copper Loss
Copper loss, also called resistive loss, is usually the largest source of heat. It often makes up 40% to 60% of total motor loss.
It mainly appears in:
- stator windings,
- rotor windings in induction motors.
Because the conductor has resistance, current passing through it creates heat based on Joule heating:
Pcu = I²R
where:
- I is winding current,
- R is winding resistance.
Copper loss rises with the square of current and also rises when resistance rises. Resistance itself increases with temperature, which creates a bad loop:
temperature rises → resistance rises → copper loss rises → temperature rises again
That loop is one of the main reasons winding hotspots get worse under load.
There is another issue in high-frequency operation. Skin effect and proximity effect can increase local copper loss, especially when the motor runs at high speed or under high-frequency drive conditions.
Iron Loss
Iron loss, also called core loss, usually makes up 20% to 30% of total motor loss.
It mainly appears in:
- the stator core,
- and the rotor core, though PMSM rotor core loss is often smaller.
Iron loss has two main parts:
- hysteresis loss, caused by repeated magnetic domain reversal,
- eddy current loss, caused by induced currents inside the core material.
Iron loss rises with:
- magnetic field frequency,
- magnetic flux density,
- and core material properties.
This is why high-speed operation can raise thermal stress sharply, even when the motor looks fine at lower speed.
Mechanical Loss
Mechanical loss usually accounts for 5% to 10% of total loss.
It includes:
- bearing friction loss,
- rotor windage loss,
- brush friction loss in DC motors.
Bearing friction depends on:
- bearing type,
- lubrication condition,
- rotational speed.
Rotor windage depends on:
- rotor speed,
- rotor surface area,
- air viscosity.
Mechanical loss is smaller than copper and iron loss in many cases, but it keeps adding heat over time and becomes more important as speed rises. In high-speed motors, this part cannot be brushed aside.
Stray Loss
Stray loss, also called additional loss, often accounts for 5% to 10% of total loss.
It may appear in:
- winding end regions,
- core lamination gaps,
- motor housing,
- other structural zones outside the main loss groups.
Its cause is more complex and depends on:
- structural design,
- manufacturing quality,
- operating condition.
Common examples include:
- leakage magnetic field at the winding ends,
- gaps at lamination joints,
- poor contact between conductors and core parts.
Stray loss is harder to calculate with precision. In high power-density motors, it can no longer be treated as a small leftover term.
How Is Heat Distributed Inside an Automotive Motor?
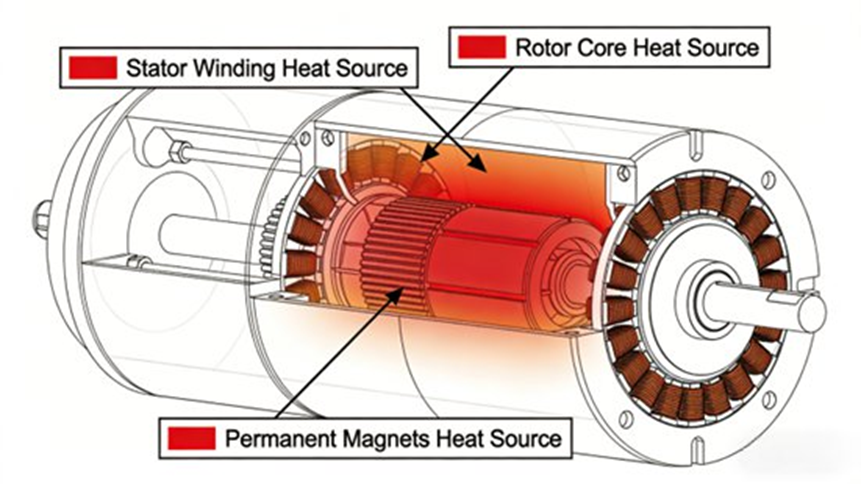
Short answer: Heat inside a motor is not evenly spread. The stator side, especially the windings, usually carries the highest temperature, while the rotor, magnets, bearings, and terminals each have their own thermal limits.
Using a permanent magnet synchronous drive motor as the reference, the heat pattern is usually uneven and concentrated in the main heat-producing parts.
Stator Side
The stator is often the hottest zone in the motor.
- Stator windings are the main heat source because of copper loss. Heat gathers in the conductor and insulation layers. Local temperature can reach 120°C to 150°C.
- Stator core heats up because of iron loss. Its temperature is often around 100°C to 120°C.
- Stator housing acts as a transfer path to the outside. Its temperature is lower, often around 80°C to 100°C.
Rotor Side
In a PMSM, the rotor has no main winding, or only a small damping winding, so rotor loss is smaller.
Rotor heating mainly comes from:
- heat conduction from the stator,
- convection through the air gap.
The permanent magnet needs special attention because it can lose magnetic strength at high temperature. In many designs, the magnet temperature is controlled below 100°C, and the risk region is often considered near 120°C, depending on magnet grade.
The rotor shaft gains heat from:
- bearing friction,
- heat transfer from the rotor core.
Its temperature is often around 70°C to 90°C.
Other Parts
- Bearings are often around 60°C to 80°C. If lubrication gets worse, the local temperature can rise fast and turn the bearing into a hotspot.
- Lead wires and terminals can also heat up because of contact resistance. Their temperature is often around 80°C to 100°C.
The main point is this:
Average motor temperature does not tell the full story.
The real thermal risk usually sits in local hotspots.
What Are the Core Methods of Electric Motor Thermal Analysis?
Short answer: The three core methods are analytical calculation, simulation analysis, and experimental testing. Each serves a different stage of design, and the best results come when all three are used together.
The goal of thermal analysis is to calculate or measure:
- temperature distribution,
- heat transfer path,
- cooling efficiency,
- hotspot position.
That gives engineers the information they need to improve thermal design before damage appears.
Analytical Thermal Calculation
Short answer: Analytical calculation is the fast early-stage method. It uses heat-transfer laws and simplified thermal models to estimate motor temperature and heat flow.
Core Principle
Analytical calculation is based on classic heat-transfer rules, such as:
- Fourier’s law for heat conduction,
- Newton’s law of cooling,
- energy conservation.
The idea is to simplify a complex motor into an equivalent thermal system. Small structural features and minor leakage paths are often left out to keep the model simple enough to solve quickly.
Key Steps
A typical analytical workflow includes:
- calculate motor losses such as copper, iron, mechanical, and stray loss,
- study the heat transfer path, including conduction, convection, and radiation,
- build an equivalent thermal resistance network,
- calculate the temperature of key parts,
- compare with real operating conditions and adjust parameters if needed.
Common Models
Thermal Resistance Network Model
This is one of the most common methods in early design.
Motor parts are treated as thermal resistance elements, such as:
- contact thermal resistance between winding and core,
- thermal resistance between core and housing,
- convective resistance between housing and ambient air.
Then the temperature difference is solved in a way similar to an electrical circuit.
This model is simple and fast, so it works well in concept design and scheme comparison.
Simplified Analytical Model
For key parts such as the stator winding or core, engineers may build:
- one-dimensional conduction models,
- two-dimensional temperature field models.
These are usually more accurate than a simple resistance network when looking at one component.
Strengths
- fast,
- low cost,
- no heavy software needed,
- useful in concept design and option screening.
Limits
- strong simplification,
- lower precision,
- weak on structural detail,
- poor at finding local hotspots,
- not enough for detailed thermal work in high power-density motors.
Simulation Analysis
Short answer: Simulation is the main detailed design tool. It uses FEM and CFD to show temperature fields, flow fields, hotspots, and cooling behavior with much more detail than hand calculation.
As computer power and numerical methods improved, simulation became the main method in automotive motor thermal work. It can include:
- detailed geometry,
- complex heat transfer,
- flow behavior,
- and multi-field interaction.
The two main branches are:
- finite element temperature field simulation, or FEM,
- CFD flow-temperature coupling simulation, or CFD.
Finite Element Temperature Field Simulation
This method uses the heat conduction equation and a three-dimensional motor model with a finite element mesh.
Engineers enter:
- heat source load from loss distribution,
- boundary conditions,
- ambient temperature,
- convective heat-transfer coefficients.
The solver then calculates nodal temperature and produces a temperature cloud map.
This method mainly focuses on heat conduction and is commonly used for static and steady-state temperature analysis.
Common software includes:
- ANSYS Maxwell for electromagnetic-thermal work,
- ANSYS Icepak,
- Simplorer.
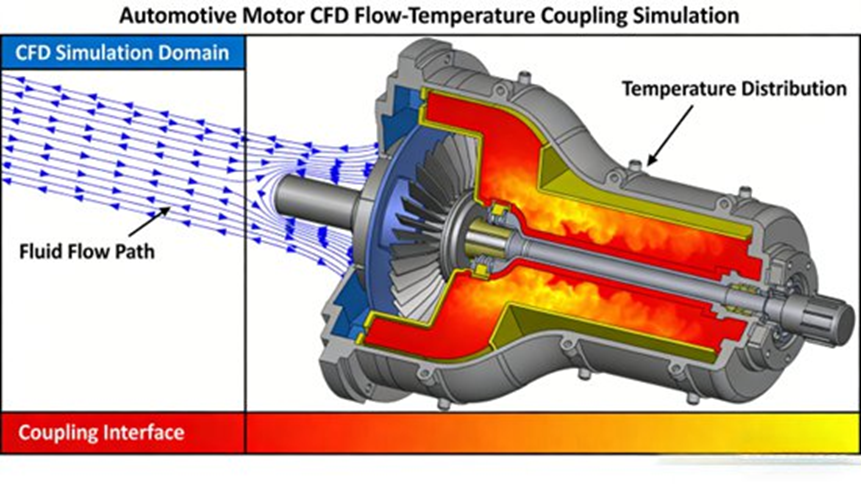
CFD Flow-Temperature Coupling Simulation
CFD is used for cooling-system analysis, especially when looking at:
- air cooling,
- water cooling,
- oil cooling.
A coupled flow-temperature model is built to simulate the cooling medium, such as:
- air,
- coolant,
- lubricating oil.
The model predicts:
- velocity distribution,
- pressure distribution,
- heat exchange process,
- cooling efficiency.
This method mainly focuses on convective heat transfer and is useful for dynamic and transient thermal analysis.
Common software includes:
- ANSYS Fluent,
- STAR-CCM+,
- AVL Fire.
Why Simulation Matters
Simulation makes the thermal problem visible. It helps engineers see:
- where the hottest point is,
- how heat moves,
- where flow dead zones appear,
- how a cooling channel really works,
- what changes after a design update.
That is why simulation is now a core design tool rather than a simple final check.
Key Simulation Steps
A common simulation workflow includes:
- Geometry modeling
Build the three-dimensional model from motor drawings. Simplify features like tiny chamfers or bolt holes if they do not affect heat flow, but keep key structures accurate. - Mesh generation
Use dense mesh in high-heat areas such as windings and core, and coarser mesh in lower-risk areas such as housing and base. This balances precision and speed. - Load and boundary setup
Enter loss distribution as heat source load and define:- convective heat-transfer coefficients,
- ambient temperature,
- cooling medium temperature,
- cooling medium flow rate.
- Solving
Choose the right numerical method for steady-state or transient analysis. - Result check
Read temperature maps, hotspot temperature, cooling efficiency, and flow results. - Validation
Compare simulation with test data and correct model parameters to improve prediction quality.
Strengths
- high precision,
- clear visual output,
- strong on detailed structures,
- useful for local hotspot detection,
- supports multi-physics coupling,
- reduces repeated hardware trials.
Limits
- more time needed for modeling and meshing,
- high computing demand,
- needs software skill and engineering judgment,
- not ideal for fast first-pass screening.
Experimental Thermal Testing
Short answer: Experimental testing is the final truth check. It gives real thermal data under real operating conditions and is used to verify both hand calculation and simulation.
Without testing, a thermal model is still only a model.
Main Measurement Methods
Thermocouple Measurement
This is the most common temperature-measurement method.
Thermocouple probes are attached to the surface of parts such as:
- winding ends,
- core,
- housing,
- bearings.
The probe converts temperature into an electrical signal, and a data acquisition system records it.
This method offers:
- high accuracy,
- low cost,
- easy setup,
- good use in dynamic and steady-state surface measurement.
Infrared Thermal Imaging
Infrared cameras record the surface temperature map of the motor and show hotspots quickly.
This method is:
- non-contact,
- wide-area,
- visual.
The report mentions professional devices such as:
- FLIR X6980™,
- FLIR T540.
Embedded Temperature Measurement
In this method, sensing parts such as PT100 resistance temperature detectors are embedded inside the motor during manufacturing, for example:
- in the winding,
- in the core.
This gives direct internal temperature data and high accuracy. Still, it raises manufacturing complexity and may affect structural integrity. It is mainly used in detailed R&D testing.
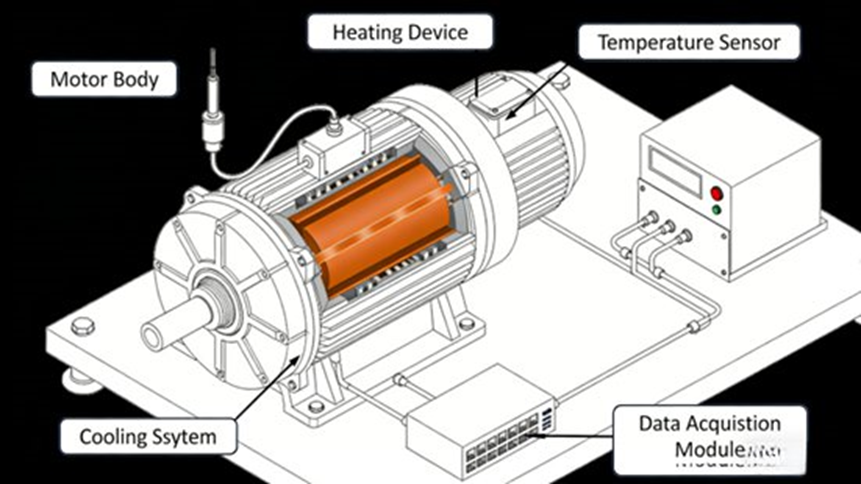
Test Platform
A typical motor thermal test platform includes:
- motor test bench,
- temperature sensors,
- data acquisition system,
- cooling system.
It should support multiple operating conditions, such as:
- rated speed,
- rated load,
- overload,
- high-speed operation.
Key Test Steps
A standard thermal-test process includes:
- build the test platform and install the motor, sensors, DAQ system, and cooling system,
- set operating conditions such as speed, load, ambient temperature, and cooling-medium parameters,
- run the motor until steady state is reached,
- record temperature data and heat-dissipation data,
- repeat under different operating conditions,
- compare results with analytical and simulation results,
- run extreme-condition tests such as overload and high ambient temperature.
In the report, steady state is defined as a condition where temperature change is less than 2°C per hour.
Strengths
- real and reliable data,
- shows actual thermal behavior,
- necessary for validation,
- useful in R&D and production inspection.
Limits
- higher cost,
- longer time,
- needs specialized equipment and space,
- not suited to fast early screening.
How the Three Methods Work Together in Engineering
Short answer: The three methods work best as one closed workflow: early estimation with analytical models, detailed design with simulation, and final confirmation with testing.
These methods are not replacements for one another. Each one fits a different stage.
Concept Design Stage
Use analytical calculation, especially thermal resistance networks, to estimate thermal performance and compare design options quickly.
Detailed Design Stage
Use simulation, especially FEM and CFD, to study complex operating conditions, local hotspots, and cooling-system behavior in detail.
R&D Validation Stage
Use experimental testing to measure actual motor thermal performance, verify the models, and correct parameters.
Mass Production Stage
Use simplified testing, such as infrared thermal imaging, for quick thermal quality checks and consistency control.
The full engineering route is:
early estimation → detailed simulation → real validation
Engineering Case Study: Thermal Optimization of an EV PMSM Drive Motor
Short answer: In the case study, an 80 kW PMSM drive motor suffered winding-end overheating under rated load and high speed. The full thermal workflow found the root cause, improved cooling, and cut temperatures to a safe range.
This example shows how thermal analysis works in real design practice.
Project Background and Thermal Risk
Motor data:
- rated power: 80 kW
- rated speed: 10,000 rpm
The first design used a traditional air-cooling system. Under rated load and high-speed operation, the motor showed serious thermal risk:
- measured winding-end temperature reached 158°C
- the winding insulation limit was 155°C
- the permanent magnet temperature came close to the demagnetization threshold of 120°C
That created a real risk of:
- insulation aging,
- permanent magnet demagnetization,
- reduced service life,
- lower operating reliability.
Step 1: Loss Calculation and Heat Source Analysis
The team first used analytical calculation to estimate the motor losses at rated condition:
- copper loss: 3.2 kW
- iron loss: 1.8 kW
- mechanical loss: 0.3 kW
- stray loss: 0.42 kW
The report states that stray loss was estimated as 8% of total loss.
The total loss was:
5.72 kW
The analysis showed that the main heat source sat in the stator winding and core, with the highest copper-loss density in the winding-end region. That made the winding end the most likely hotspot.
Step 2: Detailed Simulation Analysis
The team then used ANSYS Fluent to build a three-dimensional CFD flow-temperature coupling model.
Geometry Modeling
The model simplified non-critical structures but kept the main parts:
- stator winding,
- core,
- rotor,
- permanent magnet,
- cooling air duct.
Special care was taken with:
- the irregular shape of the winding ends,
- the stator-rotor air gap detail.
Mesh Generation
Different mesh sizes were used by region:
- 0.5 mm mesh in high-heat areas such as winding ends and core,
- 2 mm mesh in lower-risk parts such as housing and cooling duct.
The total mesh count was about 2.8 million.
Loads and Boundary Conditions
The model used:
- loss distribution as heat source load,
- ambient temperature of 25°C,
- air-cooling speed of 12 m/s,
- convective coefficients based on the cooling-duct structure.
Steady-State Coupled Simulation Result
The simulation produced these key temperatures:
- winding-end maximum temperature: 156°C
- stator-core maximum temperature: 128°C
- permanent-magnet maximum temperature: 118°C
The difference between simulation and test data was less than 3%, which showed that the model was reliable.
More important, the model found the real reason for overheating:
The cooling-air velocity was uneven, and a flow dead zone existed near the winding ends.
That weak local airflow caused poor heat removal and pushed the winding-end temperature too high.
Step 3: Thermal Management Optimization
Based on the simulation result, the design was improved in three ways:
- Cooling-duct optimization
Increase the duct cross-sectional area near the winding ends and add turbulence-promoting structures to remove flow dead zones and raise local convective heat transfer. - Higher-temperature insulation material
Upgrade the winding insulation so the thermal limit rises to 180°C, giving more safety margin. - Winding arrangement optimization
Improve the winding layout to reduce copper-loss density in the winding-end region.
Step 4: Re-Simulation After Optimization
After the design update, the next simulation showed:
- winding-end maximum temperature dropped to 142°C
- stator-core maximum temperature dropped to 116°C
- permanent-magnet maximum temperature dropped to 108°C
All key temperatures were now below the safety threshold.
Heat-dissipation efficiency also improved by 18%.
Step 5: Experimental Validation
The optimized motor was tested on a thermal test platform using:
- thermocouple measurement,
- infrared thermal imaging.
At rated condition, the measured values were:
- winding-end maximum temperature: 143°C
- stator-core maximum temperature: 117°C
- permanent-magnet maximum temperature: 109°C
The difference from simulation was less than 2%, which confirmed the thermal-analysis and optimization workflow.
Under long-term rated operation, the motor no longer showed excessive temperature rise. The report states that service life was expected to increase by more than 30%.
Engineering Takeaway From the Case
This case shows the value of the full route:
- analytical calculation finds likely heat-source areas,
- simulation shows the real thermal-flow problem,
- testing confirms the final design.
It also shows a hard truth in motor design:
Not every thermal problem starts with the material. Some start with the cooling-flow path.
How Can Engineers Improve Electric Motor Thermal Management?
Short answer: Engineers improve motor thermal performance by upgrading cooling systems, choosing better materials, and changing the structure so heat is generated less aggressively and removed more quickly.
Cooling-System Design
Common cooling methods include:
- air cooling,
- water cooling,
- oil cooling.
For high power-density motors, traditional air cooling often reaches its limit. Stronger cooling systems are needed as heat load rises.
Material Selection
Thermal performance can improve with:
- high-temperature insulation,
- improved magnetic materials,
- materials with better thermal behavior.
Structural Design Changes
Engineers can also improve thermal behavior by:
- adjusting winding arrangement,
- redesigning cooling paths,
- reducing loss concentration,
- improving local convection in hotspot areas.
Future Trends in Electric Motor Thermal Analysis
Short answer: The field is moving toward multi-physics models, smart prediction, stronger cooling technology, and integrated e-drive thermal design.
As EV motors move toward higher power density, higher speed, and higher integration, thermal analysis is changing in four clear ways.
1. Multi-Physics Coupling Is Becoming the Main Path
Future motor thermal work will not stop at a temperature-only model or a flow-only model.
It will increasingly couple:
- electromagnetic field,
- thermal field,
- fluid flow,
- structural deformation.
These fields affect one another. For example:
- temperature rise increases winding resistance and changes copper loss,
- structural deformation can change cooling-duct gaps and affect airflow,
- loss distribution and thermal stress can interact.
Electromagnetic-thermal-structural coupling can therefore predict not only temperature, but also thermal stress and deformation. That matters a lot in high power-density and high-speed motors.
2. Smart Thermal Analysis and Real-Time Monitoring
AI and data-based methods are starting to change how thermal management works.
Future systems can use:
- large sets of simulation data,
- large sets of test data,
- machine-learning models,
- real vehicle sensor data.
That allows:
- temperature prediction under different operating conditions,
- real-time thermal-state estimation,
- early warning of thermal risk,
- smarter thermal control during operation.
With onboard sensing of temperature, current, and speed, thermal analysis can move from offline design work to real-time predictive control.
3. New Cooling Technologies Are Getting Closer to Motor Design
Traditional air and water cooling do not meet every future need. New technologies are getting more attention, including:
- direct oil cooling
- oil-water combined cooling
- phase-change cooling
- heat-pipe cooling
Direct oil cooling stands out because oil can contact the winding and core more directly, giving much stronger heat transfer than older methods.
As these cooling systems get more complex, CFD and thermal testing become even more important for improving:
- cooling-channel layout,
- oil-path design,
- phase-change material placement,
- heat-pipe position.
4. Lightweight and Integrated E-Drive Systems Need Better Thermal Models
Motor systems are becoming more integrated. In some e-drive axle systems, the motor, reducer, and controller are packaged together.
That makes the heat-transfer path more complex and strengthens thermal coupling between parts.
Future analysis has to move from component-level design to full integrated thermal modeling of the whole drive system.
At the same time, lightweight materials such as:
- aluminum alloy,
- composite material
have different thermal-conductivity behavior, so the thermal model must reflect those material changes as well.
Advanced FAQs: EV Motor Thermal Analysis and Cooling Technologies
1. What are the dominant heat sources in high power-density EV motors today?
Short answer: Copper loss and iron loss are still the main heat sources, but local hotspots and stray losses are becoming much more important in compact, high-speed motor designs.
The most discussed heat sources are still:
- copper loss: 40% to 60%
- iron loss: 20% to 30%
But the current discussion has shifted toward more local and uneven heat behavior.
Three points come up often:
- high-frequency operation raises iron loss,
- compact layouts make stray loss more serious,
- winding end-turn hotspots are harder to control in small, high-speed motors.
Another shift is that thermal runaway is no longer discussed only for batteries. In integrated EV systems, motor-related thermal instability is also getting more attention.
2. Why is traditional air cooling no longer sufficient for modern EV motors?
Short answer: Air cooling often cannot remove heat fast enough in modern high power-density motors, especially when local hotspots form.
Modern EV motors can release several kilowatts of heat. In some cases, a motor can need to remove around 7 kW of heat in a 70 kW motor-class discussion scenario, which pushes air cooling close to or past its practical limit.
The problem is not only total heat. It is also local overheating.
Even if average motor temperature seems acceptable, the winding end or another compact zone may exceed the safe limit. Air has much lower heat-transfer ability than liquid-based systems.
That is why current engineering discussion is moving toward:
- water-glycol cooling,
- direct oil cooling,
- two-phase cooling,
- immersion cooling.
For high-performance EV motors, these are becoming real design options rather than rare experiments.
3. What are the most widely used thermal analysis methods in industry today?
Short answer: Industry now uses a mixed workflow of analytical models, FEM/CFD simulation, and experimental validation.
The common workflow is:
- analytical thermal models for quick early estimation,
- FEM and CFD simulation for detailed temperature and flow analysis,
- experimental testing for final validation.
Current practice is giving more weight to:
- FEM and CFD coupling,
- electromagnetic-thermal-fluid multi-physics modeling,
- simulation-driven design,
- digital-twin-style prediction.
Still, no matter how good simulation gets, testing remains necessary because model accuracy still depends on real validation data.
4. What cooling technologies are getting the most attention in 2025 and 2026?
Short answer: Direct oil cooling, oil spray cooling, phase-change materials, nanofluids, and integrated thermal systems are getting the most attention.
Several cooling methods are drawing strong interest.
Direct Oil Cooling
Oil directly contacts the winding or rotor zone. This gives much stronger heat transfer than air cooling and is becoming a serious option in high-performance EV motors.
Oil Spray Cooling
Oil is sprayed onto hotspot areas such as winding ends. It looks promising for local thermal control, though large-scale packaging and cost still need work.
Phase-Change Materials and Nanofluids
These can improve transient heat absorption and help with short-term thermal peaks.
Integrated Thermal Systems
Motor, inverter, and battery thermal control are increasingly being managed together. Heat-pump integration is also gaining more attention.
The bigger shift is clear:
Cooling design is moving from single-component thinking to full-system thermal architecture.
5. How is AI and intelligent thermal management changing motor design?
Short answer: AI is helping engineers predict temperature in real time, control cooling more actively, and avoid building motors that are heavier or more expensive than needed.
A major topic in recent engineering discussion is intelligent thermal management.
This includes:
- real-time temperature prediction using sensor data,
- machine-learning models trained with simulation and test data,
- adaptive cooling control based on road and driving condition.
The benefits include:
- higher efficiency,
- better energy use,
- earlier fault warning,
- predictive maintenance,
- lower overdesign,
- lower system weight and cost.
The direction is clear:
Motor thermal management is shifting from passive design to active control.
Key Engineering Insight
Electric motor thermal analysis is no longer only a calculation task.
It is becoming:
- system-level,
- multi-physics,
- data-based,
- tied to smart monitoring and control.
That matches the full structure of this article:
- heat mechanism,
- heat distribution,
- analytical method,
- simulation method,
- testing method,
- optimization workflow,
- future cooling and control trends.
Author Note
Johnny Liu
CEO at Dowway Vehicle
Johnny Liu leads Dowway Vehicle with a focus on EV systems, engineering commercialization, and practical technology translation for advanced mobility products. This article is written in a technical educational format so engineers, product teams, and industry readers can apply electric motor thermal-analysis logic more easily in design and communication work.
Review and Trust Note
This article is based on a detailed technical report and rewritten into a search-friendly cluster-page format. The goal is to keep the full technical logic and all critical engineering details while making the content easier to read, easier to quote, and easier for search systems and LLM-based tools to extract accurately.
Technical Disclaimer
This content is for technical education and industry reference only. Real motor thermal design, simulation settings, cooling selection, and validation limits should always be confirmed through project-specific engineering analysis, software modeling, and physical testing.
Closing Note
Heat is not a small side issue in an EV motor.
It sets the boundary for power, efficiency, reliability, and service life.
The teams that get this right do not wait for a prototype to overheat. They build thermal analysis into the design from the first step.
