
< Back to Performance Development
By Johnny Liu, CEO at Dowway Vehicle
Published: March 2, 2026
When I first started tuning engines over a decade ago, I quickly learned that raw horsepower means nothing if the car can’t push through the air or grip the road. Today, at Dowway Vehicle, my team and I build next-generation mobility solutions based on a simple truth: motion is math. This detailed guide breaks down the core principles of vehicle dynamic performance for engineers, researchers, and automotive enthusiasts.
- 1. Introduction: What is Vehicle Dynamic Performance?
- 2. Core Evaluation Indicators of Vehicle Dynamic Performance
- 3. Theoretical Calculation Basis
- 4. Key Factors Influencing Vehicle Dynamic Performance
- 5. Testing and Simulation Techniques
- 6. Traditional ICE Vehicles vs. Pure EVs: A Direct Comparison
- 7. Future Trends and Outlook
- 8. Frequently Asked Questions (FAQ)
1. Introduction: What is Vehicle Dynamic Performance?
As the auto industry shifts toward electric power and new technologies, vehicle dynamic performance matters more than ever. It goes far beyond just how a car feels on the highway. It connects directly to energy consumption, environmental targets, and how well an automaker competes in the market.
Vehicle dynamic performance means the complete ability of a vehicle—driven by its power system—to accelerate, climb hills, and reach its maximum speed while driving in a straight line on a good road surface like concrete or asphalt. At its core, it measures how well a car turns engine or motor power into forward motion against physical resistance.
Note: Dynamic Performance vs. Drivability
Traditional dynamic performance tests a vehicle’s limits under Wide Open Throttle (WOT) conditions, looking at top speed and maximum acceleration. On the other hand, drivability looks at Part Open Throttle (POT) conditions. It measures the smoothness and shift quality of the vehicle’s response to the gas pedal in everyday driving.
Why Does It Matter?
- The Driver’s Feel: It dictates what the driver feels during heavy acceleration, high-speed cruising, and passing other cars on complex roads.
- The Baseline for Safety: Excellent dynamic performance gives the car enough power reserves for emergency steering and keeps the body stable. This creates a solid foundation for braking systems and autonomous driving.
- The Industry Battleground: Powertrain efficiency shows what an automaker can really do. Engineers constantly push to improve Internal Combustion Engine (ICE) gearboxes and Electric Vehicle (EV) motor-battery setups.
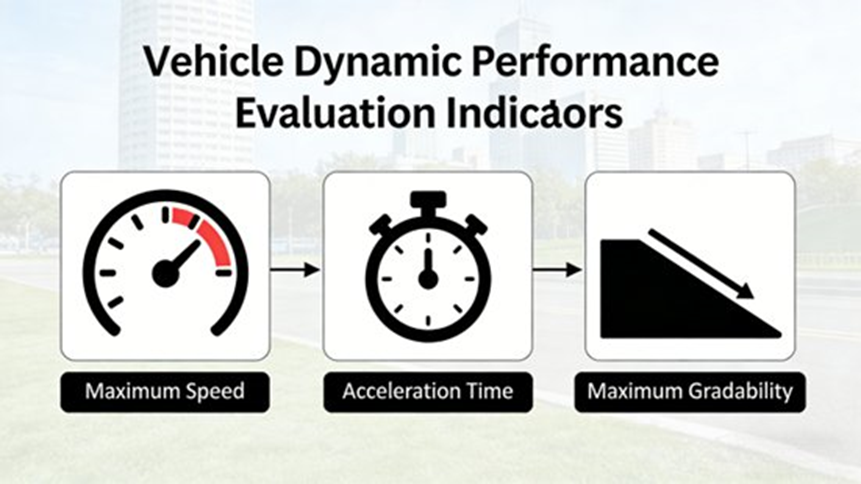
2. Core Evaluation Indicators of Vehicle Dynamic Performance
Engineers measure this performance using three main metrics.
2.1 Maximum Speed
Maximum speed (u_{max}) is the highest stable cruising speed (in km/h) a car can reach on a flat, high-quality road. The powertrain must output its rated power in the highest gear.
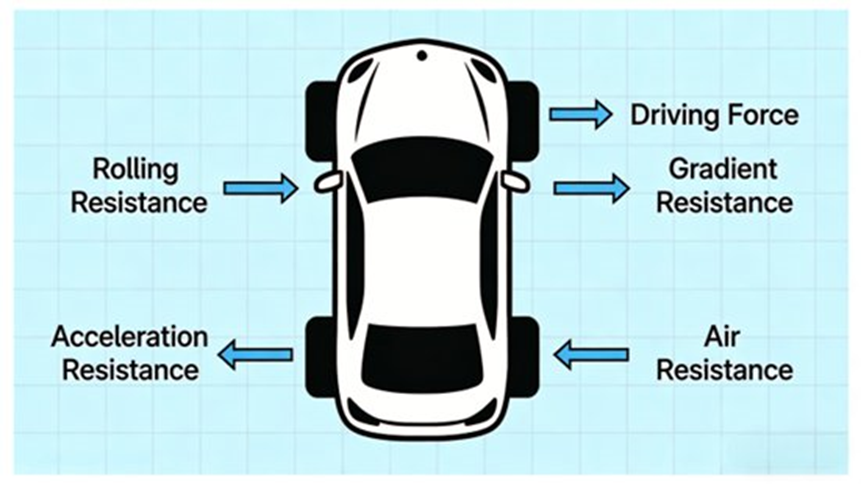
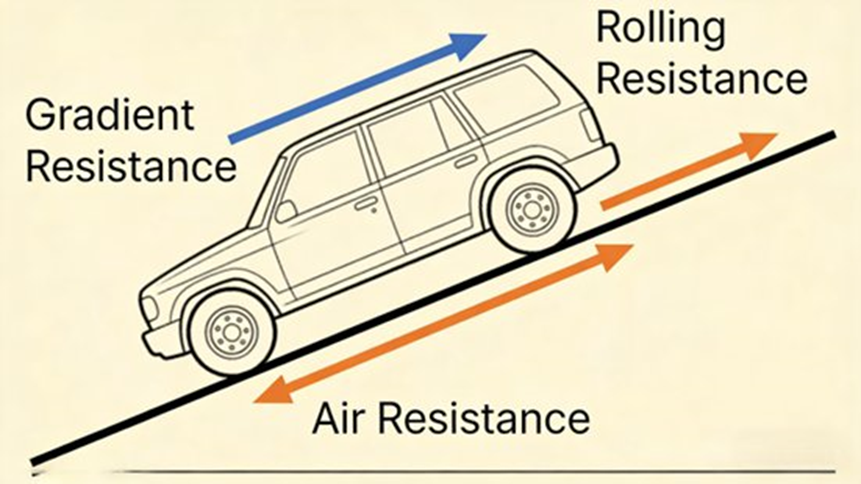
When a car hits its maximum speed, the driving force equals the sum of rolling resistance and air resistance. Gradient and acceleration resistances drop to zero. The math looks like this:
F_t = \frac{T_e \cdot i_g \cdot i_0 \cdot \eta_T}{r} = F_f + F_w
(Where T_e is rated torque, i_g is transmission gear ratio, i_0 is final drive ratio, \eta_T is transmission efficiency, r is wheel rolling radius, F_f is rolling resistance, and F_w is air resistance.)
Engineering insight: If you cut the aerodynamic drag coefficient (C_D) by just 0.01, you lower the running resistance at high speeds (like 120km/h) by a wide margin. This simple change increases top speed and saves fuel.
2.2 Acceleration Time
Acceleration time measures how quickly a car responds to the driver, counted in seconds (s).
- Standing Start Acceleration: The time it takes to go from a complete stop to a target speed (like 0-50km/h or 0-100km/h). For instance, electric light trucks usually need to hit 50km/h in under 6 seconds to handle frequent stop-and-go city deliveries.
- Overtaking Acceleration: The time it takes to speed up from a steady cruise (say, 60km/h) to a higher speed (like 80km/h) by pushing the pedal to the floor. Shorter times mean better active safety on highways.
Here is the formula for acceleration resistance:
F_j = \delta \cdot m \cdot \frac{du}{dt}
(Where m is vehicle curb weight, \frac{du}{dt} is acceleration, and \delta is the rotational mass conversion factor.) The \delta factor accounts for the inertia of rotating parts. Engineers calculate it as:
\delta = 1 + \frac{\sum I_w}{m \cdot r^2} + \frac{I_e \cdot i_g^2 \cdot i_0^2 \cdot \eta_T}{m \cdot r^2}
(Where I_w is wheel moment of inertia and I_e is engine/motor moment of inertia.)
2.3 Maximum Gradability
Maximum gradability is the steepest hill a fully loaded vehicle can climb at a steady speed in the lowest gear. We express it as a gradient angle (\alpha) or a percentage (\tan(\alpha) \times 100\%).
Heavy commercial vehicles often climb grades over 30% (about 16.5°). Electric light trucks need >20%, while standard passenger cars handle between 15% and 25%. The force balance equation is:
F_t = F_f + F_w + F_i
Gradient resistance (F_i) equals m \cdot g \cdot \sin(\alpha). For smaller hills (\alpha < 15^\circ), we simplify this to F_i \approx m \cdot g \cdot i (where i is the gradient percentage).
3. Theoretical Calculation Basis
3.1 Calculating Driving Force
- Traditional ICE Vehicles: Engine torque is non-linear. The engine hits peak torque at specific RPMs. To keep the car moving efficiently, the transmission gear ratios must match this torque curve.
- Pure EVs: Electric motors deliver peak torque linearly right from 0 RPM. Torque drops off at higher speeds, but the low-speed output remains flat and strong. This removes the need to shift gears.
3.2 Calculating Running Resistances
- Rolling Resistance (F_f = m \cdot g \cdot f): This makes up 60%-80% of resistance at low speeds. The coefficient (f) changes based on the road: 0.010-0.015 for good asphalt, 0.012-0.020 for concrete, and 0.030-0.050 for rough gravel. Higher tire pressure and narrower treads lower f.
- Air Resistance (F_w = \frac{C_D \cdot A \cdot \rho \cdot u^2}{2}): This takes over at speeds above 80km/h. For passenger cars, $C_D$ values range from 0.25-0.35 (sports cars sit below 0.20). Frontal area (A) is normally 2.0-2.5m², and standard air density ($\rho$) is 1.205kg/m³ at 20°C.
- Acceleration Resistance (F_j): EVs usually have a lower rotational mass factor ($\delta = 1.05-1.10$) compared to ICE vehicles ($\delta = 1.10-1.20$) because their drivetrains have fewer spinning parts.
4. Key Factors Influencing Vehicle Dynamic Performance
- Power System: For gas cars, rated power determines top speed, while max torque handles acceleration. For EVs, the motor’s peak torque and the battery’s State of Charge (SOC) matter most. When SOC drops below 20%, the battery limits power output, which visibly drops EV performance.
- Transmission System: Gear ratios balance low-speed pulling and high-speed driving. High transmission efficiency (\eta_T) cuts down mechanical losses from gears and bearings. EVs mostly use single-speed reducers, while ICE cars rely on multiple gears to make up for limited torque bands.
- Vehicle Body & Chassis: Sleek styling, hidden door handles, and underbody panels lower the drag coefficient (C_D) and frontal area. Lighter materials like high-strength steel, aluminum, and carbon fiber directly decrease vehicle weight (m), which drops all types of resistance. Good suspension tuning keeps the tires flat on the ground to stop power loss.
- Tires & Environment: Strong tire grip stops wheel slip during hard launches. Wider tires add grip but also increase rolling and air resistance. Environmental conditions change the math, too. High altitudes thin the air and drop ICE power, while freezing temperatures slow down EV battery chemistry.
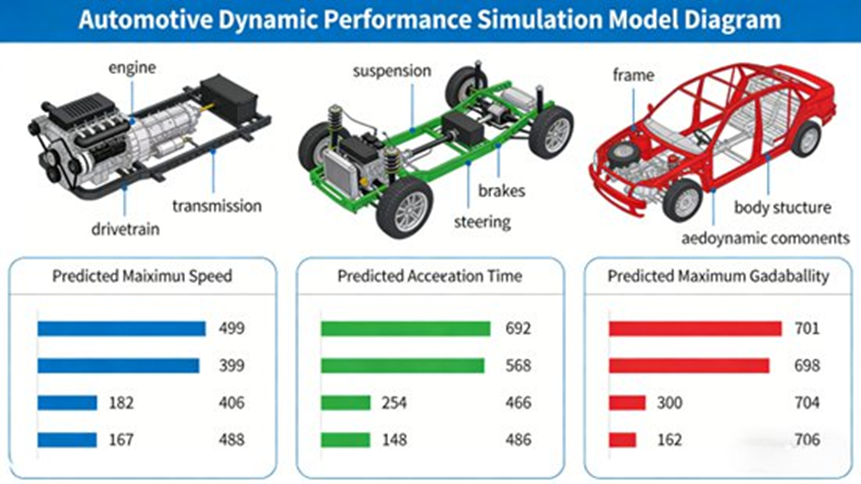
5. Testing and Simulation Techniques
5.1 Real-Vehicle Testing
Standard physical testing needs a flat road, 20±5°C ambient temperature, 1.205kg/m³ air density, and standard vehicle loads. Engineers use precise tools: speedometers (≥0.1km/h accuracy), accelerometers (≥0.01m/s²), torque sensors (≥0.5%), and data loggers (≥10Hz).
- Rule of 3: To get valid data for max speed, acceleration, and gradability, test drivers run 3 consecutive passes. They average the results for speed and time, and take the highest number for gradability.
5.2 Virtual Simulation Technology
Simulation lets teams predict performance early, saving heavy testing costs.
- Core Software: AVL Cruise handles powertrain matching, GT-Suite and MATLAB/Simulink build control strategies, and ADAMS tests chassis dynamics.
- The 4-Step Workflow: 1. Build the model. 2. Calibrate parameters using real-world data. 3. Run the simulation. 4. Iterate and optimize.
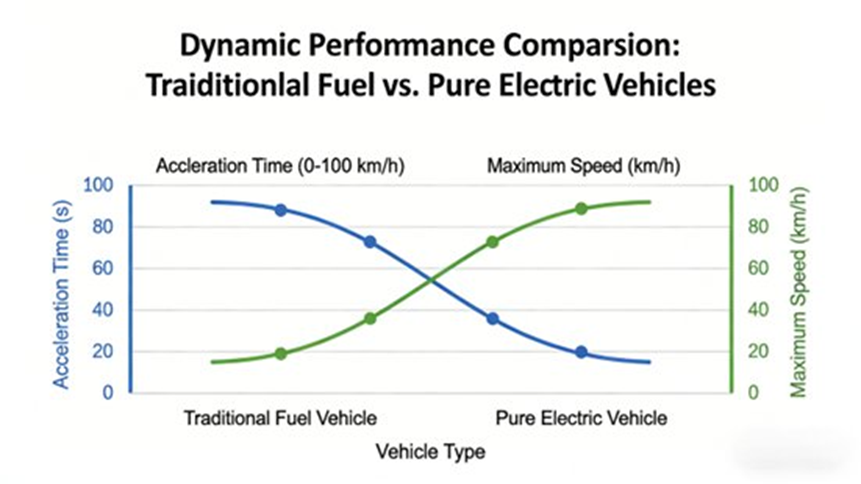
6. Traditional ICE Vehicles vs. Pure EVs: A Direct Comparison
| Feature / Metric | Traditional ICE Vehicles | Pure Electric Vehicles (EVs) |
| Power Output | Non-linear; requires RPM buildup (2000-4000 RPM for max torque); has response lag. | Linear; peak torque hits instantly at 0 RPM; highly responsive (<0.1s). |
| Acceleration Time | Slower off the line due to shifting and torque curves. | Faster 0-100km/h times due to instant torque and zero shift interruptions. |
| Maximum Speed | Higher sustained top speeds (e.g., 180-220km/h); rated power stays stable. | Lower top speeds (e.g., 150-180km/h); motor torque drops at high RPMs; battery gets hot. |
| Maximum Gradability | Strong on long steep hills without power fade. | Strong low-speed climbing, but drivers must watch battery SOC on very long hills. |
| Best Use Scenarios | Long-distance trips, high-speed cruising, and heavy mountain driving. | Urban stop-and-go commuting and short daily trips. |
7. Future Trends and Outlook
- Improving Electric Systems: Engineers want to boost high-speed motor torque and battery discharge rates to match the top speeds of gas cars. They also build highly efficient hybrid systems to get the best of both worlds.
- Lighter Materials and Smart Aero: Car designs now use carbon fiber composites and active parts—like smart grilles and adjustable rear spoilers—to cut resistance on the fly.
- Smart Control Systems: Modern cars use AI to adjust power and gears in real-time based on the steepness of the road and how the person drives.
- Combined Simulation Methods: Teams now tie dynamic performance testing directly to noise (NVH) and handling software using “Digital Twins.” This lets them track and improve the car across its entire lifecycle.
8. Frequently Asked Questions (FAQ)
Q1: What is vehicle dynamic performance?
Answer: Vehicle dynamic performance refers to how a vehicle behaves and responds when it moves—especially under acceleration, braking, steering, and different road conditions. It covers stability, handling, ride comfort, and how the vehicle reacts to the driver and outside forces. This field uses classical mechanics to explain and predict vehicle motion.
Q2: What factors most influence vehicle dynamic performance?
Answer: The main factors include:
- Forces & Moments: Longitudinal (accelerating/braking), lateral (cornering), and vertical (bump response) forces acting on the car.
- Tires: Tire grip, pressure, and slip at the contact patch.
- Suspension & Chassis: Suspension geometry and damping change stability and comfort.
- Weight Distribution & Center of Gravity: These dictate rollover resistance and handling balance.
- Electronic Control Systems: Stability control (ESC), traction control, and torque vectoring adjust power in real time.
Together, these elements determine how stable, responsive, and safe a vehicle feels on the road.
Q3: Why are handling and stability fundamental to dynamic performance?
Answer: Handling describes how well a car responds to the steering wheel and takes corners. Stability refers to its ability to stay under control and resist skidding. A balanced car acts predictably when steering, braking, or accelerating, which keeps the driver safe and confident. Principles like load transfer, yaw stability, and lateral acceleration explain these behaviors.
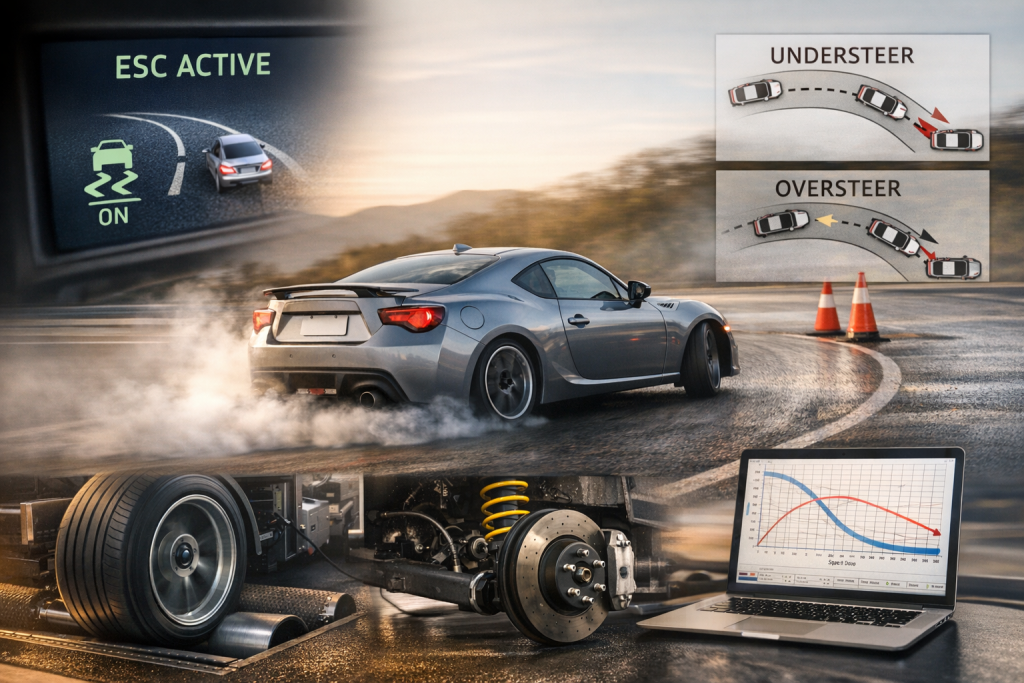
Q4: What’s the difference between understeer and oversteer?
Answer: Understeer and oversteer are classic terms describing how a car corners:
- Understeer: The vehicle turns less than the driver wants; the front tires lose grip before the rear.
- Oversteer: The vehicle turns more sharply than the driver wants; the rear tires lose grip first, which can lead to a spin.
Understeer is generally safer for everyday drivers, while racers often use controlled oversteer on the track.
Q5: How do electronic stability systems affect dynamic performance?
Answer: Electronic Stability Control (ESC) and similar systems constantly monitor the vehicle. If they detect a problem, they intervene by braking individual wheels or cutting engine torque to keep the car under control. They improve handling by keeping the vehicle on its intended path during sudden swerves or on slippery roads.
