
News & Video

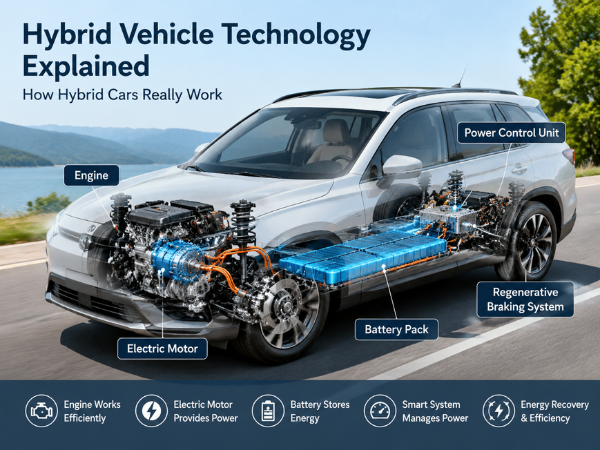
Hybrid vehicle technology explained with a transparent car design showing the engine, electric motor, battery pack, power control unit, and regenerative braking system.

Hybrid Vehicle Technology Explained: How Hybrid Cars Really Work

Published: July 27, 2026Last Updated: July 27, 2026 Written by Johnny LiuCEO at Dowway Vehicle About the Author Johnny Liu is the CEO at Dowway Vehicle, focusing on vehicle technology trends, automotive innovation, and the development of electrified mobility solutions. Through studying global vehicle technologies and market changes, Johnny focuses on one key question: How […]
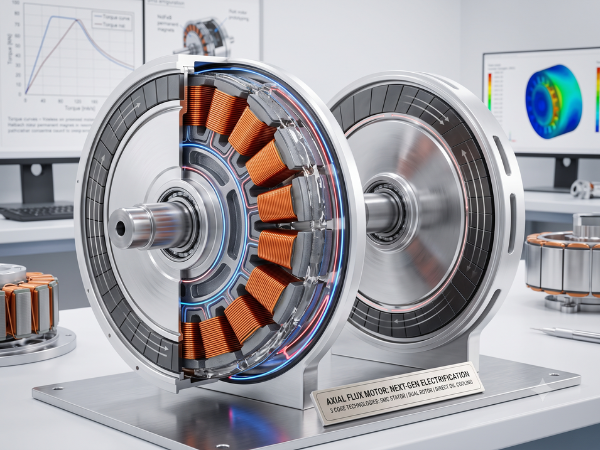
A detailed, brightly lit cutaway visualization of a next-generation axial flux electric motor prototype mounted on a test stand in a modern engineering laboratory. The image reveals the internal "pancake" structure, showcasing copper coil windings, rotor disks with permanent magnets, and blue/red lines illustrating internal cooling paths. In the background, computer monitors display technical graphs and simulation data.

Axial Flux Motors: Fundamentals and the 3 Core Technologies Shaping Next-Gen Electrification

1. Introduction: The Shift in Electric Motor Design For over a century, the electric vehicle (EV) industry and industrial automation relied almost exclusively on Radial Flux Motors (RFM). In a radial flux design, magnetic flux travels radially outward across a cylindrical air gap between concentric rotor and stator elements. While reliable and mature, conventional radial

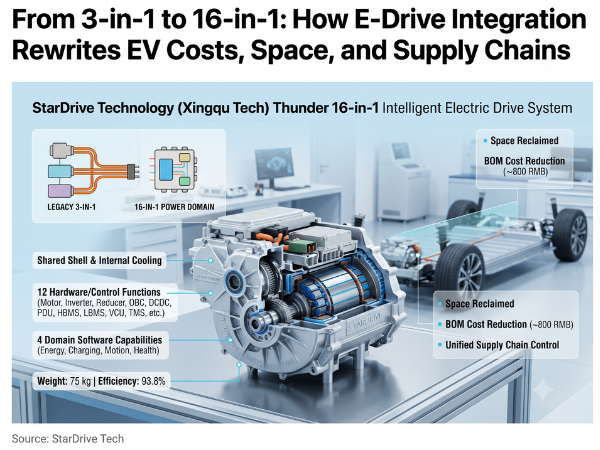
Alt Text: A detailed infographic comparing the legacy 3-in-1 EV drive system with the StarDrive (Xingqu Tech) Thunder 16-in-1 Intelligent Electric Drive System. The image features a large technical cutaway view of the integrated 16-in-1 unit, highlighting internal components like the motor, reducer, and inverter within a shared shell. Annotations detail its specifications, including 12 hardware and control functions, 4 domain software capabilities, a weight of 75kg, and an efficiency of 93.8%. Diagrams illustrate reclaimed space and an estimated BOM cost reduction of approximately 800 RMB.

From 3-in-1 to 16-in-1: How E-Drive Integration Rewrites EV Costs, Space, and Supply Chains

By: Johnny Liu | CEO at Dowway Vehicle Published: July 22, 2026 Category: Automotive Powertrain Architecture & Supply Chain Strategy Reading Time: 14 min read What is a 16-in-1 E-Drive System? A 16-in-1 electric drive (e-drive) system combines 12 hardware and control functions with 4 domain software capabilities into one physical assembly. First built commercially

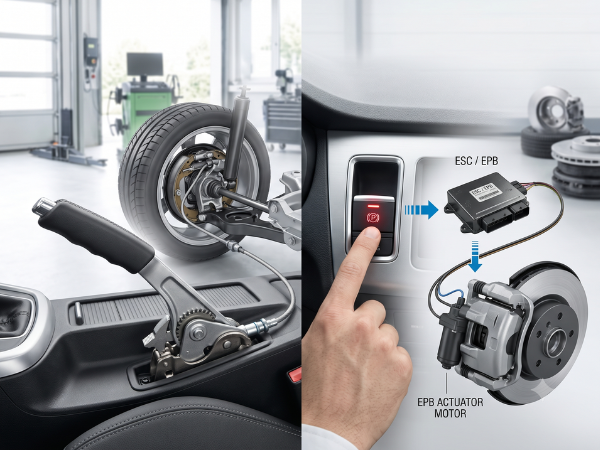
Side-by-side comparison illustrating a traditional mechanical handbrake lever with its cable-driven rear suspension system (left) versus a modern electronic parking brake button, ECU, and motorized caliper (right) with directional arrows showing the digital control flow.

Mechanical Handbrake (PB) vs. Electronic Parking Brake (EPB): Technical Mechanics, Differences, and Future Trends

Author Biography Johnny Liu is the Chief Executive Officer at Dowway Vehicle, a global provider of automotive chassis solutions, braking technologies, and aftermarket components. With over 20 years of hands-on mechanical engineering and executive leadership in automotive manufacturing, Johnny specializes in modern vehicle safety architectures, drive-by-wire system integration, and braking component design. Executive Summary What

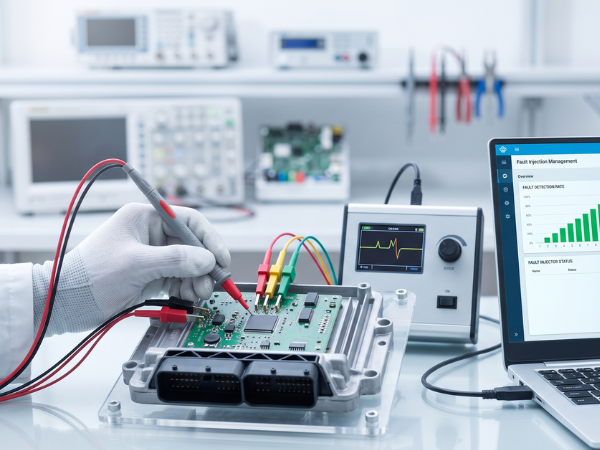
A close-up photograph capturing an engineer's hand wearing a white glove, gently probing a central processor unit (CPU) on an open automotive engine control unit (ECU). The ECU is connected by a cable to a multi-channel signal generator with a display showing waveform, and then to a laptop. The laptop screen displays 'Fault Injection Management' software, showcasing charts like 'Fault Detection Rate' (green bars) and 'Fault Injector Status', indicating an ongoing fault injection reliability test. The background is a well-lit, professional electronics development lab with an oscilloscope and other equipment blurred.

Testing IC and Software Reliability: A Practical Guide to Fault Injection

Author: Johnny Liu, CEO at Dowway Vehicle Published: July 21, 2026 Category: Embedded Systems, Automotive Safety, Hardware Engineering, Compliance As the CEO of Dowway Vehicle, where we build safety-critical systems for cars, I know that reliability is not just a checkbox. In our line of work, an undetected chip failure or a brief software error

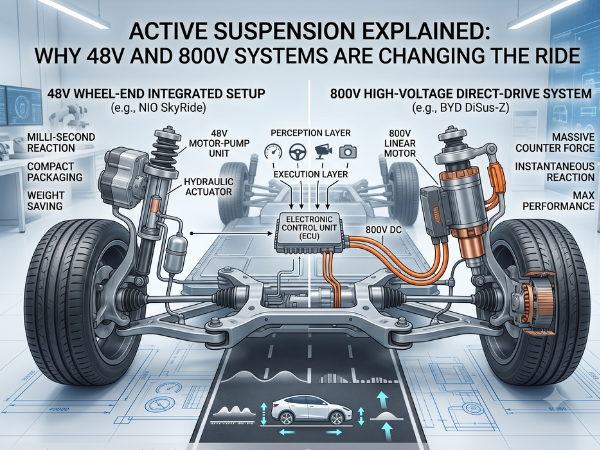
A detailed infographic comparing 48V and 800V active suspension systems for electric vehicles. The left side shows a NIO SkyRide wheel-end unit with an integrated 48V motor and gear pump. The right side shows an EV chassis diagram illustrating an 800V direct drive linear motor/pump system. Both sides include detailed diagrams of the internal mechanisms, ECU connections, and use cases: comfort-focused filtering for 48V and performance-focused anti-roll for 800V.

Active Suspension Explained: Why 48V and 800V Systems Are Changing the Ride

Electrification is changing cars fast. But the real shift is happening underneath, right at the chassis. For decades, we relied on mechanical linkages to keep cars stable. Today, those physical connections are giving way to software-defined, drive-by-wire active suspension systems. This is not just a minor upgrade. It is a major shift in how cars

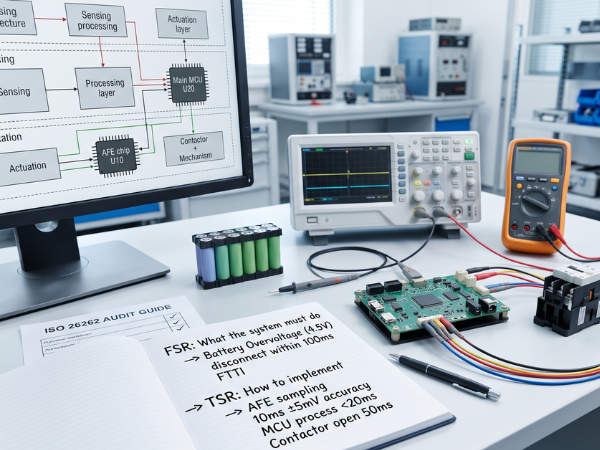
A brightly lit engineering lab bench featuring a BMS development board connected to an oscilloscope and multimeter, with a notebook in the foreground showing FSR and TSR technical specifications for battery overvoltage protection.

From Abstract Safety Goals to Concrete Code: The FSR to TSR Conversion Guide for BMS Engineers

Many automotive teams face a common roadblock during ISO 26262 audits. They define high-level Safety Goals (SG). They establish the Fault Tolerant Time Interval (FTTI). Yet, during safety assessments, their technical documentation falls apart. Why does this happen? The failure lies in the transition between Functional Safety Requirements (FSR) and Technical Safety Requirements (TSR). When

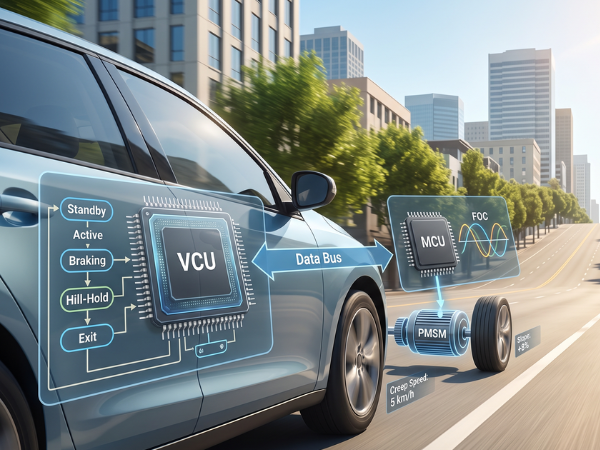
A technical diagram overlaid on a realistic image of an electric car driving uphill. On the left, the Vehicle Control Unit (VCU) chip is shown with a state machine flowchart (Standby, Active, Braking, Hill-Hold, Exit). It connects via a Data Bus to the Motor Control Unit (MCU) chip on the right, which shows Field-Oriented Control (FOC) waveforms. The MCU drives a Permanent Magnet Synchronous Motor (PMSM) connected to a wheel. Text overlays indicate a speed of 5 km/h on an 8% slope.

Mastering EV Low-Speed Creep Control: From State Machine Logic to MCU FOC Implementation

Author Biography & Authority Johnny Liu is the Chief Executive Officer at Dowway Vehicle, a builder of electric vehicle (EV) powertrain solutions and advanced Vehicle Control Unit (VCU) architectures. With over 15 years of hands-on R&D experience in motor drive systems, automotive embedded systems, and functional safety (ISO 26262), Johnny has led the development of

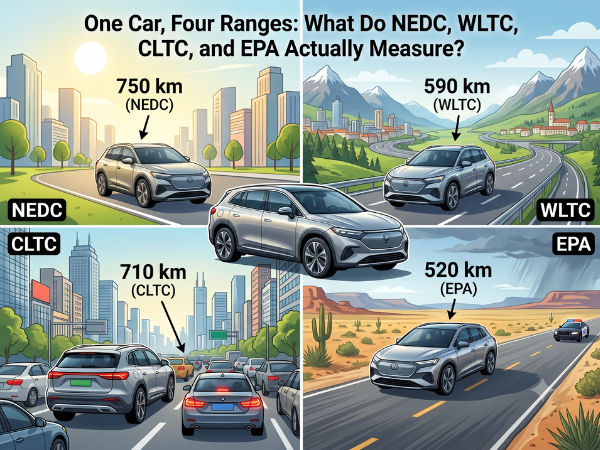
Infographic showing the range of a single EV model under different driving cycle standards: NEDC (750 km), WLTC (590 km), CLTC (710 km), and EPA (520 km). The image also breaks down the simulated distance, average speed, maximum speed, climate control, and extreme temperature testing for each standard.

One Car, Four Ranges: What Do NEDC, WLTC, CLTC, and EPA Actually Measure?

Author: Johnny Liu, CEO at Dowway Vehicle Published: July 16, 2026 Category: EV Technology, Fleet Management, Automotive Industry Insights Imagine you are shopping for a new electric car. You look at the spec sheet and see a massive puzzle. Under the NEDC standard, the car claims a range of 750 km. Under China’s CLTC, it

Need a Quote or Have Questions?

Please fill out the form below, our engineers will contact you within 24 hours.