



By Johnny Liu, CEO at Dowway Vehicle
- Author: Johnny Liu, CEO at Dowway Vehicle
- Published: June 15, 2026
- Category: Automotive Engineering / Functional Safety (FuSa)
Quick Takeaway
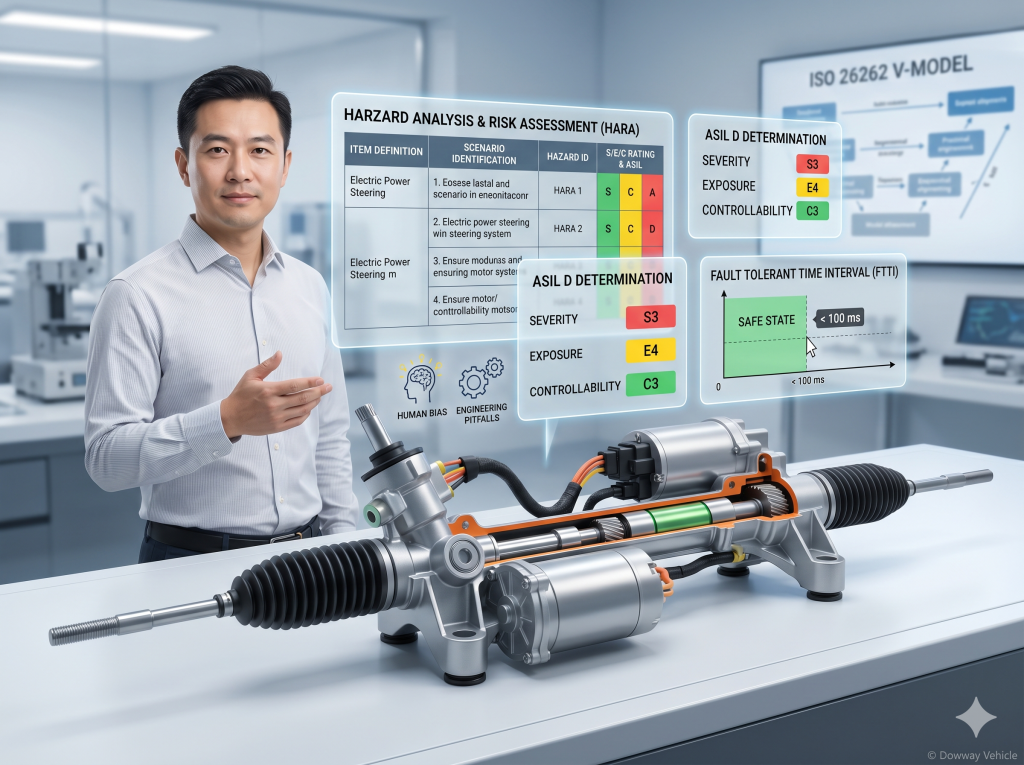
Hazard Analysis and Risk Assessment (HARA) is the starting point of the ISO 26262-3 Concept Phase. It spots hazards caused by system failures and rates their risk using three metrics: Severity (S), Exposure (E), and Controllability (C). These scores combine to give you an Automotive Safety Integrity Level (ASIL) from QM up to ASIL D. This guide uses an Electric Power Steering (EPS) system to show you a complete, audit-ready HARA workflow.
Table of Contents
1. Introduction to HARA & Its Strategic Position in the ISO 26262 V-Model
When you build safety-critical automotive systems like steer-by-wire or drive-by-wire platforms, HARA (Hazard Analysis and Risk Assessment) is your first real engineering step. It sits at the very top of the ISO 26262 V-Model under Part 3 (Concept Phase). HARA answers a simple, high-stakes question:
“When a system part fails, how dangerous is it to the people inside and outside the car?”
HARA acts as the technical bridge between your product’s basic setup (Item Definition) and your high-level engineering targets (Safety Goals). Without a sharp HARA, everything downstream is guess-work. You cannot build a proper Functional Safety Concept (FSC) or write Technical Safety Requirements (TSR) if you do not know what hazards you are trying to stop.
The main output of a HARA is the ASIL (Automotive Safety Integrity Level). Do not treat ASIL A and ASIL D as mere regulatory grades. The difference between them changes your development workload, timeline, and budget by a factor of ten:
- ASIL A: Requires standard engineering quality setups with minor extra paperwork.
- ASIL D: Requires 100% MC/DC (Modified Condition/Decision Coverage) in your software tests, deep quantitative FMEDA to calculate hardware failure metrics (PMHF), and hardware-level fault tolerance (like lockstep processors or dual power paths).
If you under-rate your ASIL, you leave dangerous gaps in your vehicle. If you over-rate it, you waste millions of dollars on over-engineering.
2. Why HARA is the Most Challenging Step in Functional Safety
Even though the rules look clear on paper, HARA is notoriously hard to get right. It usually breaks down over three specific engineering friction points:
I. The Driving Scenario Trap: Too Many vs. Too Few
ISO 26262 says you must check failures across a realistic list of driving situations. But the real world has infinite paths. You can mix speeds, road grip, weather, and driver inputs forever. Teams usually fail in one of two directions:
- The Spreadsheet Explodes: Engineers document thousands of tiny scenario variations, ending up with massive, unreadable documents.
- Blind Spots: Engineers write down only perfect conditions (like “driving straight on a dry highway on a sunny day”) and miss dangerous edge cases.
- How to solve this: Use a structured OEDR (Operating Environment & Driving Routine) checklist to group and limit your scenarios logically.
II. The Human Bias of S/E/C Ratings
While Severity (S) links to real medical injury scales, Exposure (E) and Controllability (C) are highly subjective. Controllability—how well a normal driver can handle a failure—causes the most arguments. It is common for two engineers on the same team to look at the same failure and argue between C1 (easy to handle) and C3 (extremely hard to handle). You must ground these scores in numbers, not guesses.
III. The Ghost Defect Loop
HARA mistakes are silent. If you miss a hazard during the HARA phase, you will not write a safety goal for it. Because you do not have a safety goal, your test engineers will not write a test case for it. Your system will pass every validation test in the lab with flying colors, but it will still have a fatal safety flaw when customers start driving it.
3. Step-by-Step ISO 26262 HARA Workflow (With EPS Case Study)
Let us walk through the six steps of a standard HARA using an Electric Power Steering (EPS) system as our physical reference.
Step 1: Item Definition (Establishing the Baseline)
You cannot start a HARA without a frozen, version-tracked Item Definition. This document sets the boundaries of your system. It must list exactly what the system does, its physical limits, interfaces, speed ranges, and how it behaves when things go wrong.
Table 1: Item Definition Key Elements & HARA Impacts (EPS Example)
| Dimension | Specific Content for EPS | Direct Impact on HARA |
|---|---|---|
| Functional Boundaries | Steering torque assistance, active return, active damping, lane-keeping assist (LKA) interface. | Determines the scope of failure modes under consideration. |
| System Boundaries & Interfaces | Vehicle speed (from ABS/ESC via CAN-FD), steering wheel angle (from SAS), power supply (12V/48V). | Identifies external signal failures that could propagate into the EPS. |
| Operating Conditions | High speed, low speed, parking assist, reverse gear, hill assist. | Establishes the foundational dimensions of the scenario matrix. |
| Environmental Conditions | Operating temperature ($-40^\circ\text{C}$ to $+85^\circ\text{C}$), humidity, vibration profile, EMC limits. | Influences the Exposure (E) rating of external environmental stressors. |
| Functional Limitations | Max assist torque (e.g., $80\text{ Nm}$), maximum vehicle speed for LKA intervention. | Sets the physical boundary limits of unintended system behavior. |
Step 2: Operational Scenario Identification (OEDR Matrix)
Using the operating and environmental conditions from your Item Definition, build a matrix of scenarios. Use the OEDR (Operating Environment & Driving Routine) method to structure this step.
Table 2: Operational Scenario Dimension Matrix
| Dimension | Classification Values | Typical Engineering Scenarios |
|---|---|---|
| Vehicle Speed | Very Low ($<5\text{ km/h}$), Low ($5-30\text{ km/h}$), Mid ($30-80\text{ km/h}$), High ($>80\text{ km/h}$). | Parking, urban stop-and-go, rural driving, highway cruising. |
| Road Friction ($\mu$) | High Friction ($\mu \approx 1.0$), Mid, Low (Wet/Ice, $\mu \le 0.3$), Non-Asphalt. | Dry concrete, heavy rain, black ice, gravel roads. |
| Driving Maneuver | Straight-line driving, lane change, curving/turning, emergency avoidance. | Highway cruising, highway exit ramp, urban intersection turn. |
| Road Category | Highway, Urban Arterial, Rural Highway, Parking Lot. | Controlled-access expressway, intersections, single-lane bridges. |
Step 3: Hazard Event Identification (Failure Modes vs. Scenarios)
Now, map the core failure modes of your E/E system against your scenario matrix. The standard failure modes to evaluate are:
- Loss of Function (System stops working completely)
- Partial Function (System performance drops)
- Unintended Activation (System turns on when it should be off)
- Incorrect/Reverse Function (System acts opposite to driver intent)
- Stuck/Locked Function (System output gets frozen)
For our EPS, these failures turn into specific hazards. Write every hazard statement using this structure: “When [Scenario], due to [Failure Mode], [Hazardous Event] occurs, leading to [Vehicle-Level Harm].”
Table 3: EPS Representative Hazard Events
| ID | System Failure Mode | Driving Scenario | Vehicle-Level Hazard & Harm |
|---|---|---|---|
| H-01 | Complete loss of steering assistance. | High-speed ($>80\text{ km/h}$) highway curving. | Sudden spike in driver effort; vehicle unable to maintain curve; lane departure/crash. |
| H-02 | Unintended reverse assist torque. | High-speed ($>80\text{ km/h}$) straight cruising. | Sudden unexpected pull to the left/right; vehicle enters oncoming lane; rollover/head-on collision. |
| H-03 | Unintended self-steering activation. | Low-speed ($<5\text{ km/h}$) parking assist. | EPS commands steering rack to maximum lock; collision with nearby pedestrians/vehicles. |
| H-04 | Steering rack/column lock (stuck). | Mid-speed ($30-80\text{ km/h}$) lane change. | Steering wheel cannot be turned; vehicle locked in lateral path; side-impact collision. |
Step 4: S/E/C Rating & Quantitative Guidelines
The core risk assessment consists of rating three parameters: Severity ($S$), Exposure ($E$), and Controllability ($C$).
I. Severity ($S$)
This rates how badly a person is hurt during the worst-case outcome of the hazard. It maps to the medical AIS (Abbreviated Injury Scale).
- S0 (No injuries): No bodily harm.
- S1 (Light/Moderate): Simple cuts, scrapes, or mild bruises.
- S2 (Severe/Life-threatening): Deep wounds, broken bones; survival is highly likely.
- S3 (Fatal/Critical): Life-threatening injuries, major organ damage; survival is uncertain.
II. Exposure ($E$)
This rates how much time a driver spends in the specific driving scenario.
- E1 (Very Low): Rare situations (like extreme weather or highly specific off-road tracks).
- E2 (Low): Occurs only a few times a year.
- E3 (Medium): Occurs weekly or monthly (like highway overtaking).
- E4 (High): Part of almost every drive (like standard road speeds or normal turns).
III. Controllability ($C$)
This rates whether a normal driver can take action to avoid the accident.
- C0 (Controllable): Easy to handle; does not cause a hazard.
- C1 (Easy to Control): Over 99% of drivers can easily keep the car safe.
- C2 (Normally Controllable): 90% to 99% of drivers can handle the failure with normal inputs.
- C3 (Difficult to Control): Under 90% of drivers can prevent an accident.
? Real-World Engineering Rule for Controllability: To pass an audit, do not guess your C-ratings. Ground them in driver reaction times. Studies show unalerted drivers take 0.6 seconds to 0.8 seconds to react to unexpected steering changes.
- If an EPS failure (like$H-02$, Unintended Reverse Torque) causes the car to leave its lane in less than 0.5 seconds, the driver has no physical time to fix it. This is a clear C3.
- If the path deviation takes more than 2.0 seconds, a normal driver has plenty of time to counter-steer or brake. You can justify a C1 or C2 rating here.
Table 4: S/E/C Rating Standard Definitions & Calibration Data
| Dimension | Class | Definition | Quantitative / Empirical Calibration Anchor |
|---|---|---|---|
| S | S3 | Fatal / Critical Injuries | AIS 5-6 (Survival probability $<90\%$, severe spinal/head trauma) |
| S2 | Severe / Life-threatening | AIS 3-4 (Severe fractures, organ laceration, survival highly probable) | |
| S1 | Light / Moderate | AIS 1-2 (Whiplash, minor fractures, short-term hospitalization) | |
| S0 | No Injuries | AIS 0 (No physiological damage, standard minor bump) | |
| E | E4 | High Probability | Scene encountered in $>10\%$ of average driving operating time |
| E3 | Medium Probability | Scene encountered in $1\% – 10\%$ of driving operating time | |
| E2 | Low Probability | Scene encountered in $0.1\% – 1\%$ of driving operating time | |
| E1 | Very Low Probability | Scene encountered in $<0.1\%$ of driving operating time | |
| C | C3 | Difficult to Control | Reaction window $<0.6\text{ seconds}$; requires highly skilled race-driver maneuvers |
| C2 | Normally Controllable | Reaction window $0.6 – 1.2\text{ seconds}$; standard counter-steering or braking avoids collision | |
| C1 | Easily Controllable | Reaction window $>1.2\text{ seconds}$; simple release of throttle or mild braking avoids danger | |
| C0 | Completely Controllable | Safely handled via standard automated chassis control (e.g., passive mechanical link) |
Step 5: ASIL Determination
Now, use the standard ISO 26262 matrix to find the ASIL level based on your S, E, and C scores.
Table 5: ISO 26262 ASIL Determination Matrix
| Severity (S) | Exposure (E) | Controllability C1 | Controllability C2 | Controllability C3 |
|---|---|---|---|---|
| S1 | E1 | QM | QM | QM |
| E2 | QM | QM | QM | |
| E3 | QM | QM | QM | |
| E4 | QM | QM | ASIL A | |
| S2 | E1 | QM | QM | QM |
| E2 | QM | QM | ASIL A | |
| E3 | QM | ASIL A | ASIL B | |
| E4 | ASIL A | ASIL B | ASIL C | |
| S3 | E1 | QM | QM | ASIL A |
| E2 | QM | ASIL A | ASIL B | |
| E3 | ASIL A | ASIL B | ASIL C | |
| E4 | ASIL B | ASIL C | ASIL D |
Step 6: Formulating Safety Goals
The final output of your HARA is a set of Safety Goals (SGs). Every hazard with an ASIL rating (ASIL A through D) must have at least one Safety Goal.
To be useful, your Safety Goals must meet four rules:
- They must be verifiable: You can write a clear pass/fail test for them.
- They must have clear limits: State the specific speeds, forces, or times they apply to.
- They must show the ASIL level: Inherited directly from the hazard.
- They must define the FTTI: Specify the Fault Tolerant Time Interval.
What is the Fault Tolerant Time Interval (FTTI)? FTTI is the maximum time allowed between an electrical fault occurring and the system successfully entering a Safe State. If the system takes longer than the FTTI to isolate the fault, the vehicle will enter an uncontrollable state.
Table 6: EPS Safety Goals & FTTI Allocation (Derived from HARA)
| Ref | Safety Goal (SG) | Inherited ASIL | Defined Safe State | FTTI |
|---|---|---|---|---|
| SG-01 | The EPS shall not produce a steering assistance torque opposite to the driver’s intended direction when vehicle speed $v > 30\text{ km/h}$. | ASIL D | Transition to Fail-Safe: Immediately disable steering power stage; cut motor assist; fall back to purely mechanical steering. | $< 100\text{ ms}$ |
| SG-02 | The EPS shall prevent unintended steering self-activation without driver steering input. | ASIL D | Disable steering power stage; open physical safety relay; notify driver via instrument cluster. | $< 200\text{ ms}$ |
| SG-03 | The EPS shall limit the maximum self-steering torque during parking assist mode ($v < 10\text{ km/h}$) to prevent vehicle collision. | ASIL A | Limit motor phase current to cap mechanical torque output to $< 5\text{ Nm}$. | $< 500\text{ ms}$ |
4. EPS Case Study: ASIL Divergence Analysis
One of the most important concepts in functional safety is that ASIL is not a property of a system; it is a property of a specific hazard scenario. Let us look at two different situations involving the exact same EPS hardware:
Case A: EPS Complete Loss of Assist during High-Speed Cornering ($H-01$)
- Scenario: Driving $>80\text{ km/h}$ on a sharp highway ramp.
- Failure: The EPS motor controller burns out, and steering assist drops immediately to zero.
- Risk Evaluation:
- Severity ($S3$): If assist drops during a sharp turn at high speed, the driver must suddenly apply massive force to keep the car in the lane. If they fail, the car exits the road. This can easily lead to a fatal accident ($S3$).
- Exposure ($E4$): Driving on curving ramps is something highway drivers do every day ($E4$).
- Controllability ($C3$): Because the assist drops instantly while the driver is actively turning, the reaction window is tiny. Normal drivers cannot apply the high corrective force fast enough to stay in the lane ($C3$).
- ASIL Result: $$\text{S3} + \text{E4} + \text{C3} \longrightarrow \mathbf{ASIL\ D}$$
Case B: EPS Unintended Self-Steering during Low-Speed Parking ($H-03$)
- Scenario: Driving $<5\text{ km/h}$ in a parking garage.
- Failure: The EPS controller has a memory error and commands full steering torque to the left.
- Risk Evaluation:
- Severity ($S2$): At walking speeds, hitting a pillar or another car might cause structural damage, but it is highly unlikely to kill anyone ($S2$).
- Exposure ($E3$): Drivers park their cars every day, but doing so while active system errors occur is moderately low on a time-ratio scale ($E3$).
- Controllability ($C1$): At low speeds, the car has almost no momentum. Even if the wheels turn unexpectedly, the driver can easily press the brake pedal to stop the car instantly. The reaction window is wide ($C1$).
- ASIL Result: $$\text{S2} + \text{E3} + \text{C1} \longrightarrow \mathbf{ASIL\ A}$$
Table 7: Comparative Analysis of EPS Hazard Events & ASIL Outputs
| ID | Hazard Event | S Rating | E Rating | C Rating | Final ASIL | Dominant Driver of ASIL Rating |
|---|---|---|---|---|---|---|
| H-01 | High-speed sudden loss of assist | S3 | E4 | C3 | ASIL D | Extreme speed, zero reaction window, lateral acceleration. |
| H-02 | High-speed unintended reverse assist | S3 | E4 | C3 | ASIL D | Direct, active path deviation at speed is inherently fatal. |
| H-03 | Low-speed unintended steering | S2 | E3 | C1 | ASIL A | Low kinetic energy; driver brakes easily override steering path. |
| H-04 | Mid-speed lane change lockup | S3 | E3 | C2 | ASIL C | Intermediate exposure; driver can brake to control path, but path is locked. |
5. The 5 Common Engineering Pitfalls in HARA (And How to Prevent Them)
Over my years leading chassis engineering at Dowway Vehicle, I have seen five common traps that engineering teams fall into when writing HARAs.
Pitfall 1: Leaving Out Bad Weather and Tough Road Conditions
Many teams write their scenarios for perfect conditions: dry, sunny, and normally loaded cars. They forget that failures behave differently in bad weather.
- The Risk: If you do not evaluate a steering lockup on icy roads ($\mu \le 0.15$), you miss the fact that steering controllability changes completely when tires lose traction.
- The Fix: Add a bad-weather check to your OEDR template. Force your team to rate every hazard under wet, icy, and overloaded conditions.
Pitfall 2: Using “Gut Feel” for Controllability ($C$)
Engineers often give a hazard a $C1$ or $C2$ simply to push the final ASIL rating down to $QM$ or $ASIL\ A$. This saves them development work later. They write lazy justifications like: “The driver will feel the pull and naturally steer back.”
- The Risk: A professional safety auditor will immediately flag this as an unsupported assumption and reject your certification.
- The Fix: Make a rule that any rating of $C1$ or $C2$ for a serious failure must be backed by data. Use driving simulator reports, track tests, or published driver reaction studies. If you do not have hard numbers, you must write it down as a $C3$.
Pitfall 3: Writing Vague Safety Goals
Writing empty statements like “The steering system shall always be safe” is useless.
- The Risk: Your test engineers cannot build a physical pass/fail test for “being safe.”
- The Fix: Every Safety Goal must have clear, measurable limits. State the exact forces, speeds, or times the system must meet to be considered safe.
Pitfall 4: Broken Traceability After ASIL Decomposition
ISO 26262 lets you split a high-level safety requirement into two lower-level, redundant requirements (for example, splitting an ASIL D goal into two ASIL B(D) paths). Often, teams do this on paper but forget to update the links in their requirements tracking tools (like Jama or DOORS).
- The Risk: During a later design update, an engineer might change one of the redundant paths without realizing they have broken the overall ASIL D safety assumption.
- The Fix: Use your requirements management software to enforce strict, unbroken links from your HARA hazards all the way down to your software test cases.
Pitfall 5: The “Review-by-Email” Trap
Because HARA happens early in the project, safety managers often write the entire spreadsheet alone in their office and then email a 200-row file to hardware, software, and test leads for a quick digital signature.
- The Risk: The software lead signs it without realizing that the $100\text{ ms}$ FTTI limit is impossible to meet given their microcontroller loop times. The test lead signs it without realizing they do not have the lab equipment to simulate the failure.
- The Fix: Mandate a live, in-person HARA review workshop. You cannot lock your HARA baseline until the hardware, software, systems, and test leads have gone through every row together.
Table 8: The HARA Hazard & Mitigation Matrix
| Pitfall | Core Threat | Concrete Engineering Solution |
|---|---|---|
| #1 | Scenario Omission | Mandate an OEDR Checklist including low-friction, heavy-load, and night scenarios. |
| #2 | Subjective C-Rating | Require empirical driver-reaction statistics for all C1 and C2 claims. |
| #3 | Vague Safety Goals | Enforce the “Verifiability Rule”: SGs must be testable via binary pass/fail criteria. |
| #4 | Decomposed Traceability | Implement end-to-end digital threads in Jama/DOORS with ASIL tag validation. |
| #5 | Email Sign-off Silo | Conduct cross-functional interactive HARA workshops with logged engineering action items. |
6. Audit Readiness: Surviving a TÜV/SGS Assessment
When a third-party safety auditor checks your HARA, they are looking at your engineering logic, not just your final scores. Here are the five questions they will ask:
Q1: “How do you guarantee that your HARA is mapped to the exact, current version of the Item Definition?”
- Direct Answer: We lock both files together in our tracking system under the exact same release ID.
- Detailed Explanation: This prevents the HARA from drifting away from the actual vehicle architecture as developers make design changes. Our configuration management process mandates that any change to the Item Definition automatically flags the HARA for review.
Q2: “What empirical data did you use to justify rating the Controllability of [Hazard X] as C1/C2 instead of C3?”
- Direct Answer: We used driver-in-the-loop simulator test logs with 50 unalerted test drivers.
- Detailed Explanation: To prove a C2 rating, our tests showed that $96\%$ of our test group successfully kept the vehicle in its lane when the failure occurred during a turn, reacting within an average of $0.85\text{ seconds}$. We do not allow subjective “expert driver” opinions to set our ratings.
Q3: “Who attended your HARA Review, and where is the action item resolution log?”
- Direct Answer: We held a physical workshop with leads from hardware, software, systems, testing, and safety.
- Detailed Explanation: All meeting notes, sign-offs, and open issues are stored in our project tracking tool. We do not allow “review-by-email.” We can show you the history of every action item and how it was resolved before we signed off on the safety goals.
Q4: “What methodology did you use to ensure your driving scenarios are complete and you did not omit critical edge cases?”
- Direct Answer: We used a structured OEDR framework built on the scenario lists in ISO 26262-3 Annex B.
- Detailed Explanation: We systematically checked every combination of vehicle speed, road surface grip, driver maneuver, and road type. This ensures we did not just choose convenient, easy-to-solve driving situations.
Q5: “How are field-returned issues and subsequent design changes mapped back to update this HARA?”
- Direct Answer: Every design update or field issue must go through a formal safety impact analysis first.
- Detailed Explanation: If a change affects the system boundaries, performance limits, or failure behaviors, our change management tool automatically opens a task to update and re-verify the HARA.
Table 9: TÜV/SGS HARA Assessment Checklist & Evidence Map
| Auditor Challenge Theme | Underlying Compliance Intent | Required Engineering Evidence Material |
|---|---|---|
| Input Baseline | Verifying input integrity & consistency. | Document ID links, locked Item Definition baseline, matching change history dates. |
| Rating Objectivity | Hunting for unjustified “ASIL downgrades.” | Human factors test reports, driving simulator trial logs, published academic safety statistics. |
| Team Competency | Verifying cross-functional representation. | Review meeting minutes, logged action items, engineer training & competency records. |
| Completeness | Ensuring zero critical scenario omissions. | Completed OEDR checklists, HAZOP tables, FMEA boundary diagrams. |
| Lifecycle Integration | Verifying continuous safety management. | Change request forms, HARA revision history logs, Impact Analysis reports. |
7. Profile of a World-Class Functional Safety Team
Building safe vehicles requires an engineering culture that values honesty and technical depth. The best safety teams share several core traits:
- They freeze their Item Definition first: They do not rush into the HARA. They spend the necessary weeks mapping interfaces, signals, and physical limits before they write a single hazard row.
- They encourage technical debate: They do not look for easy consensus. They welcome developers challenging systems engineers and test leads questioning safety managers. It is far better to have a hard debate in a meeting room than a safety recall on the road.
- They use integrated databases, not offline sheets: While spreadsheets are easy to use, top teams manage their safety data in connected ALM tools. This ensures that when a hazard changes, all linked requirements and test cases update automatically.
- They build for Fail-Operational behavior: For critical systems like steer-by-wire, they do not just shut down when a fault occurs. They design redundant power, communication, and control paths so the vehicle can continue to steer safely even after a major component fails.
8. Closing Thoughts: HARA is an Asset, Not a Process Burden
Do not treat HARA as a administrative exercise to satisfy an auditor. When done correctly, HARA is a powerful systems engineering tool. It helps you find design flaws early, keeps your development costs under control, and protects the lives of the people who drive your vehicles.
By anchoring your S/E/C ratings in physical driver reaction data, using structured scenario templates to cover the real world, and keeping your requirements fully linked, you can build safe, reliable systems that pass audits on the first try.